124 Onley Rd Salisbury, MD 21804
South Salisbury NeighborhoodEstimated Value: $193,777 - $218,000
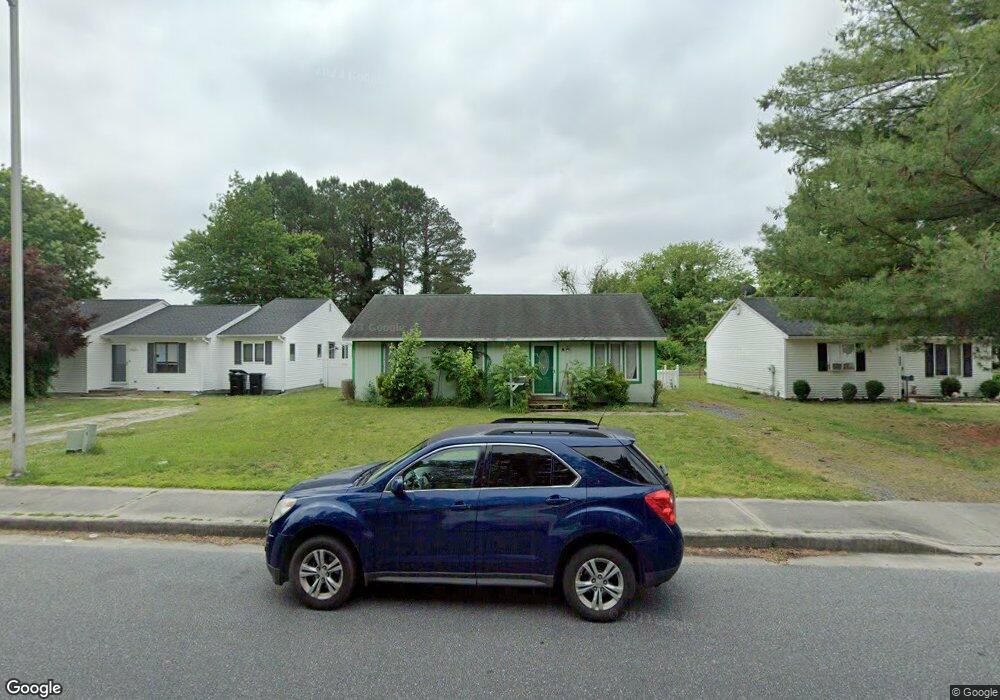
About This Home
This home is located at 124 Onley Rd, Salisbury, MD 21804 and is currently estimated at $209,694, approximately $218 per square foot. 124 Onley Rd is a home located in Wicomico County with nearby schools including Prince Street Elementary School, Bennett Middle School, and James M. Bennett High School.
Ownership History
We collect this data history from publicly available records. To have your information removed, we recommend requesting removal directly through your county’s website.
Purchase Details
Home Financials for this Owner
Home Financials are based on the most recent Mortgage that was taken out on this home.Purchase Details
Home Financials for this Owner
Home Financials are based on the most recent Mortgage that was taken out on this home.Purchase Details
Purchase Details
Home Financials for this Owner
Home Financials are based on the most recent Mortgage that was taken out on this home.Home Values in the Area
Average Home Value in this Area
Purchase History
We collect this data history from publicly available records. To have your information removed, we recommend requesting removal directly through your county’s website.
| Date | Buyer | Sale Price | Title Company |
|---|---|---|---|
| $134,000 | -- | ||
| $134,000 | -- | ||
| $61,500 | -- | ||
| $7,000 | -- |
Mortgage History
We collect this data history from publicly available records. To have your information removed, we recommend requesting removal directly through your county’s website.
| Date | Status | Borrower | Loan Amount |
|---|---|---|---|
| Open | $120,600 | ||
| Closed | $120,600 | ||
| Previous Owner | $25,000 | ||
| Closed | -- |
Tax History
We collect this data history from publicly available records. To have your information removed, we recommend requesting removal directly through your county’s website.
| Year | Tax Paid | Tax Assessment Tax Assessment Total Assessment is a certain percentage of the fair market value that is determined by local assessors to be the total taxable value of land and additions on the property. | Land | Improvement |
|---|---|---|---|---|
| 2025 | $1,150 | $125,833 | $0 | $0 |
| 2024 | $983 | $102,500 | $14,300 | $88,200 |
| 2023 | $990 | $100,133 | $0 | $0 |
| 2022 | $996 | $97,767 | $0 | $0 |
| 2021 | $978 | $95,400 | $14,300 | $81,100 |
| 2020 | $978 | $94,867 | $0 | $0 |
| 2019 | $987 | $94,333 | $0 | $0 |
| 2018 | $1,929 | $93,800 | $14,300 | $79,500 |
| 2017 | $1,782 | $86,567 | $0 | $0 |
| 2016 | -- | $79,333 | $0 | $0 |
| 2015 | $1,431 | $72,100 | $0 | $0 |
| 2014 | $1,431 | $72,100 | $0 | $0 |
Map
- 1165 S Division St
- 119 Hall Dr
- 152 Onley Rd
- 123 Francis Dr
- 201 Carrollton Ave
- 1005 Marion St
- 321 Carrollton Ave
- 310 Princeton Ave
- 1028 Adams Ave Unit 3 B
- 1405 Bantry Ln
- 917 Spring Ave
- 316 S Haven Ave
- 915 Green Mor Ave
- 1504 S Division St
- 1111 Grant Ave
- 112 Johnson Dr
- 1301 Aspen Dr
- 1007 Pierce Ave
- 227 Pinehurst Ave
- 904 Hanson St
Ask me questions while you tour the home.