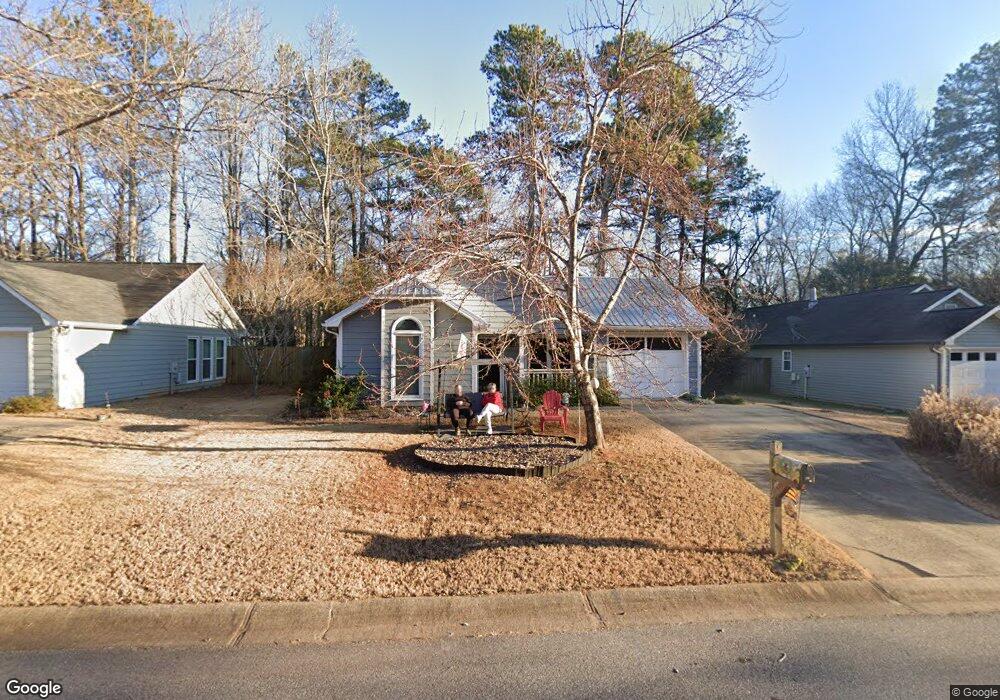
125 Lea Ct Athens, GA 30605
Estimated Value: $266,000 - $286,059
2
Beds
2
Baths
1,039
Sq Ft
$264/Sq Ft
Est. Value
About This Home
This home is located at 125 Lea Ct, Athens, GA 30605 and is currently estimated at $274,265, approximately $263 per square foot. 125 Lea Ct is a home located in Clarke County with nearby schools including Barnett Shoals Elementary School, Hilsman Middle School, and Cedar Shoals High School.
Ownership History
Date
Name
Owned For
Owner Type
Purchase Details
Closed on
Dec 1, 2020
Sold by
Dixon Katherine D
Bought by
Jenkins J Scott J and Jenkins Corale K
Current Estimated Value
Purchase Details
Closed on
May 23, 2016
Sold by
Lepene Valerie J
Bought by
Dixon Katherine D
Purchase Details
Closed on
Sep 27, 2010
Sold by
Berry Natalie J
Bought by
Lepene Valerie J
Home Financials for this Owner
Home Financials are based on the most recent Mortgage that was taken out on this home.
Original Mortgage
$115,445
Interest Rate
4.25%
Mortgage Type
FHA
Purchase Details
Closed on
Jul 26, 2004
Sold by
Deuson Robert R Patricia Deuso
Bought by
Berry Natalie J
Purchase Details
Closed on
Aug 3, 2001
Sold by
Perkins Christine A and James Mi
Bought by
Deuson Robert R Patricia Deuson and Deuson N
Purchase Details
Closed on
Jul 10, 1998
Sold by
Kelly Patrick T
Bought by
Perkins Christine A and James Michael
Purchase Details
Closed on
Sep 22, 1992
Sold by
Davis Mark A
Bought by
Kelly Patrick T
Create a Home Valuation Report for This Property
The Home Valuation Report is an in-depth analysis detailing your home's value as well as a comparison with similar homes in the area
Purchase History
| Date | Buyer | Sale Price | Title Company |
|---|---|---|---|
| Jenkins J Scott J | $164,000 | -- | |
| Dixon Katherine D | $115,520 | -- | |
| Lepene Valerie J | $117,000 | -- | |
| Berry Natalie J | $119,500 | -- | |
| Deuson Robert R Patricia Deuson | $107,000 | -- | |
| Perkins Christine A | $85,000 | -- | |
| Kelly Patrick T | $61,000 | -- |
Source: Public Records
Mortgage History
| Date | Status | Borrower | Loan Amount |
|---|---|---|---|
| Previous Owner | Lepene Valerie J | $115,445 |
Source: Public Records
Tax History
| Year | Tax Paid | Tax Assessment Tax Assessment Total Assessment is a certain percentage of the fair market value that is determined by local assessors to be the total taxable value of land and additions on the property. | Land | Improvement |
|---|---|---|---|---|
| 2025 | $3,642 | $117,286 | $12,000 | $105,286 |
| 2024 | $3,642 | $106,858 | $12,000 | $94,858 |
| 2023 | $3,339 | $98,820 | $12,000 | $86,820 |
| 2022 | $2,624 | $82,267 | $10,400 | $71,867 |
| 2021 | $2,207 | $65,490 | $8,800 | $56,690 |
| 2020 | $2,042 | $60,596 | $8,800 | $51,796 |
| 2019 | $1,883 | $55,476 | $8,800 | $46,676 |
| 2018 | $1,734 | $51,086 | $8,800 | $42,286 |
| 2017 | $0 | $46,192 | $8,800 | $37,392 |
| 2016 | $1,390 | $40,942 | $8,800 | $32,142 |
| 2015 | $1,342 | $39,478 | $8,800 | $30,678 |
| 2014 | $1,350 | $39,657 | $8,800 | $30,857 |
Source: Public Records
Map
Nearby Homes
- 155 Lea Ct
- 148 Warren Way
- 215 Milford Dr
- 450 Ansley Dr
- 109 Layla Ct
- 120 Sterling Dr
- 0 Barnett Shoals Rd Unit Lot 1
- 108 Winthrop Ct
- 233 Wakefield Trace
- 360 Ansley Dr
- 195 Gibbons Way
- 370 Ansley Dr
- 380 Ansley Dr
- 400 Ansley Dr
- 259 Wakefield Trace
- 620 Snapfinger Dr
- 223 Oconee River Cir
- 121 Ashbrook Dr
- 164 Foreman Dr
- 174 Stonybrook Ct
Your Personal Tour Guide
Ask me questions while you tour the home.