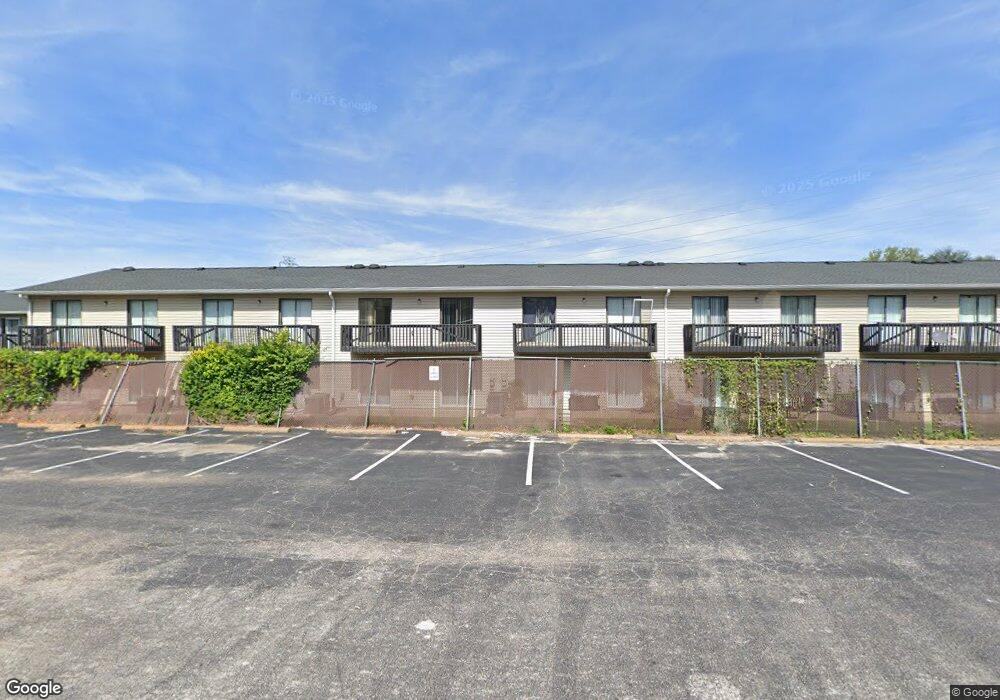
12507 James Patrick Ln Unit 2 Saint Louis, MO 63138
Estimated Value: $24,000 - $106,000
2
Beds
1
Bath
778
Sq Ft
$76/Sq Ft
Est. Value
About This Home
This home is located at 12507 James Patrick Ln Unit 2, Saint Louis, MO 63138 and is currently estimated at $58,859, approximately $75 per square foot. 12507 James Patrick Ln Unit 2 is a home located in St. Louis County with nearby schools including Arrowpoint Elementary School, Southeast Middle School, and Hazelwood East High School.
Ownership History
Date
Name
Owned For
Owner Type
Purchase Details
Closed on
Oct 31, 2025
Sold by
Aptsinstl Llc
Bought by
Tsk Reserve Llc
Current Estimated Value
Home Financials for this Owner
Home Financials are based on the most recent Mortgage that was taken out on this home.
Original Mortgage
$4,656,000
Outstanding Balance
$4,656,000
Interest Rate
6.3%
Mortgage Type
New Conventional
Estimated Equity
-$4,597,141
Purchase Details
Closed on
Jan 11, 2019
Sold by
North County Investment Group Llc
Bought by
North County Apartments Llc
Home Financials for this Owner
Home Financials are based on the most recent Mortgage that was taken out on this home.
Original Mortgage
$1,237,500
Interest Rate
4.8%
Mortgage Type
Future Advance Clause Open End Mortgage
Purchase Details
Closed on
Aug 6, 2003
Sold by
Dalton Chris
Bought by
North County Investment Group Llc
Purchase Details
Closed on
May 1, 2003
Sold by
Farris Marty T
Bought by
Dalton Christopher K
Purchase Details
Closed on
Aug 6, 2002
Sold by
Hempen Stacey M
Bought by
Dalton Chris
Create a Home Valuation Report for This Property
The Home Valuation Report is an in-depth analysis detailing your home's value as well as a comparison with similar homes in the area
Home Values in the Area
Average Home Value in this Area
Purchase History
| Date | Buyer | Sale Price | Title Company |
|---|---|---|---|
| Tsk Reserve Llc | -- | None Listed On Document | |
| North County Apartments Llc | $1,650,000 | True Title Company Llc | |
| North County Investment Group Llc | -- | -- | |
| Dalton Christopher K | -- | -- | |
| Dalton Chris | -- | -- | |
| Hempen Stacey M | $15,000 | -- |
Source: Public Records
Mortgage History
| Date | Status | Borrower | Loan Amount |
|---|---|---|---|
| Open | Tsk Reserve Llc | $4,656,000 | |
| Previous Owner | North County Apartments Llc | $1,237,500 |
Source: Public Records
Tax History
| Year | Tax Paid | Tax Assessment Tax Assessment Total Assessment is a certain percentage of the fair market value that is determined by local assessors to be the total taxable value of land and additions on the property. | Land | Improvement |
|---|---|---|---|---|
| 2025 | $380 | $4,310 | $1,100 | $3,210 |
| 2024 | $380 | $4,060 | $890 | $3,170 |
| 2023 | $371 | $4,060 | $890 | $3,170 |
| 2022 | $354 | $3,400 | $970 | $2,430 |
| 2021 | $349 | $3,400 | $970 | $2,430 |
| 2020 | $395 | $3,570 | $1,100 | $2,470 |
| 2019 | $378 | $3,570 | $1,100 | $2,470 |
| 2018 | $328 | $2,850 | $440 | $2,410 |
| 2017 | $327 | $2,850 | $440 | $2,410 |
| 2016 | $322 | $2,770 | $740 | $2,030 |
| 2015 | $311 | $2,770 | $740 | $2,030 |
| 2014 | $395 | $3,510 | $170 | $3,340 |
Source: Public Records
Map
Nearby Homes
- 1432 San Salvador Dr
- 12511 Hillview Dr
- 1453 Columbia Hills Ct
- 12373 Santa Maria Dr
- 12322 Spanish Pond Rd
- 12223 Fontaine Ln
- 12087 Trampe Heights Ln
- 12829 Spanish Pond Rd
- 12215 Spanish Blvd
- 12019 Krenning Ln
- 1510 Trampe Ave
- 1366 Trampe Ave
- 1198 Soria St
- 1125 Soria St
- 1445 Fairmeadows Ln
- 1427 Fairmeadows Ln
- 935 Murcia St
- 2 Gimlin Place
- 11905 Homestead Ave
- 11948 Bridgevale Ave
- 12511 James Patrick Ln Unit 3
- 12507 James Patrick Ln Unit B
- 12503 James Patrick Ln Unit A
- 12503 James Patrick Ln Unit 1
- 12515 James Patrick Ln
- 12519 James Patrick Ln Unit E
- 12519 James Patrick Ln Unit 5
- 12515 James Patrick Ln Unit D
- 12511 James Patrick Ln Unit C
- 12523 James Patrick Ln Unit F
- 12523 James Patrick Ln
- 1559 James Patrick Ln
- 1563 James Patrick Ln Unit B
- 1567 James Patrick Ln Unit C
- 1575 James Patrick Ln
- 1563 James Patrick Ln Unit 2G
- 1571 James Patrick Ln Unit D
- 1567 James Patrick Ln Unit 3
- 1575 James Patrick Ln Unit E
- 1571 James Patrick Ln Unit 4
Your Personal Tour Guide
Ask me questions while you tour the home.