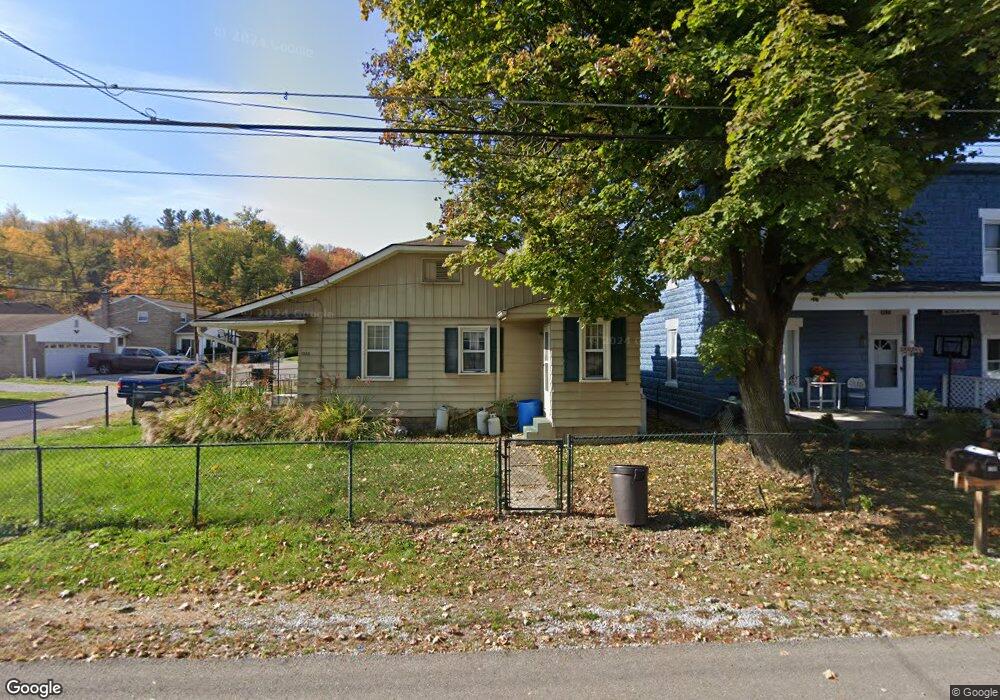
1253 Needham St Crescent, PA 15046
Estimated Value: $91,000 - $107,000
2
Beds
1
Bath
750
Sq Ft
$134/Sq Ft
Est. Value
About This Home
This home is located at 1253 Needham St, Crescent, PA 15046 and is currently estimated at $100,251, approximately $133 per square foot. 1253 Needham St is a home located in Allegheny County with nearby schools including Moon Area High School, Our Lady Of Fatima Elementary School, and Montessori Children's Community.
Ownership History
Date
Name
Owned For
Owner Type
Purchase Details
Closed on
Jan 19, 2018
Sold by
Neal Jeffrey A and Neal Daniel A
Bought by
Neal Jeffery A
Current Estimated Value
Purchase Details
Closed on
Oct 22, 2015
Sold by
Szczypinski Christopher J
Bought by
Neal Jeffrey A and Neal Daniel A
Home Financials for this Owner
Home Financials are based on the most recent Mortgage that was taken out on this home.
Original Mortgage
$53,927
Outstanding Balance
$42,415
Interest Rate
3.87%
Mortgage Type
FHA
Estimated Equity
$57,836
Purchase Details
Closed on
Aug 16, 2002
Sold by
Federal National Mortgage Association
Bought by
Szczypinski Christopher J
Purchase Details
Closed on
May 30, 2002
Sold by
Butera Ralph R
Bought by
Federal National Mortgage Association
Purchase Details
Closed on
Apr 13, 2001
Sold by
Narvett Debra L
Bought by
Butera Ralph R
Purchase Details
Closed on
May 31, 1995
Sold by
Hamilton Vicki S and Mcintire John E
Bought by
Narvett Debra L
Create a Home Valuation Report for This Property
The Home Valuation Report is an in-depth analysis detailing your home's value as well as a comparison with similar homes in the area
Home Values in the Area
Average Home Value in this Area
Purchase History
| Date | Buyer | Sale Price | Title Company |
|---|---|---|---|
| Neal Jeffery A | -- | None Available | |
| Neal Jeffrey A | $60,000 | None Available | |
| Szczypinski Christopher J | $30,000 | -- | |
| Federal National Mortgage Association | $25,000 | -- | |
| Butera Ralph R | $52,000 | -- | |
| Narvett Debra L | $41,500 | -- |
Source: Public Records
Mortgage History
| Date | Status | Borrower | Loan Amount |
|---|---|---|---|
| Open | Neal Jeffrey A | $53,927 |
Source: Public Records
Tax History
| Year | Tax Paid | Tax Assessment Tax Assessment Total Assessment is a certain percentage of the fair market value that is determined by local assessors to be the total taxable value of land and additions on the property. | Land | Improvement |
|---|---|---|---|---|
| 2025 | $1,336 | $37,200 | $25,000 | $12,200 |
| 2024 | $1,336 | $37,200 | $25,000 | $12,200 |
| 2023 | $1,295 | $37,200 | $25,000 | $12,200 |
| 2022 | $1,258 | $37,200 | $25,000 | $12,200 |
| 2021 | $176 | $37,200 | $25,000 | $12,200 |
| 2020 | $1,174 | $37,200 | $25,000 | $12,200 |
| 2019 | $1,697 | $37,200 | $25,000 | $12,200 |
| 2017 | $1,694 | $55,200 | $25,000 | $30,200 |
Source: Public Records
Map
Nearby Homes
- 909 Harper Rd
- 919 Harper Rd
- 101 Mcgovern Blvd
- Lot 1 Brodhead Rd
- Lot 2 Brodhead Rd
- Lot 3 Brodhead Rd
- 726 Rodney St
- 347 Washington St
- 694 Oak St
- 2219 Hill Rd
- 1353 Front St
- 189 Beaver St
- 878 Bocktown Rd
- 244 Spring Run Rd
- 258 Spring Run Rd
- 318-320 Beaver St
- 136 Maplewood Ave
- 20 Beech St
- 250 Park Rd
- 207 Locust St
- 1268 Needham St
- 1266 Needham St
- 1251 Mckee St
- 1270 Needham St
- 1264 Needham St
- 1259 Mckee St
- 1254 Needham St
- 1248 Mckee St
- 1248 Mckee St
- 165 Needham St
- 1257 Mckee St
- 1272 Needham St
- 1261 Mckee St
- 1263 Mckee St
- 1274 Needham St
- 1274 Needham St
- 1265 Needham St
- 1278 Hindmarch St
- 1231 Division St
- 1233 Division St
Your Personal Tour Guide
Ask me questions while you tour the home.