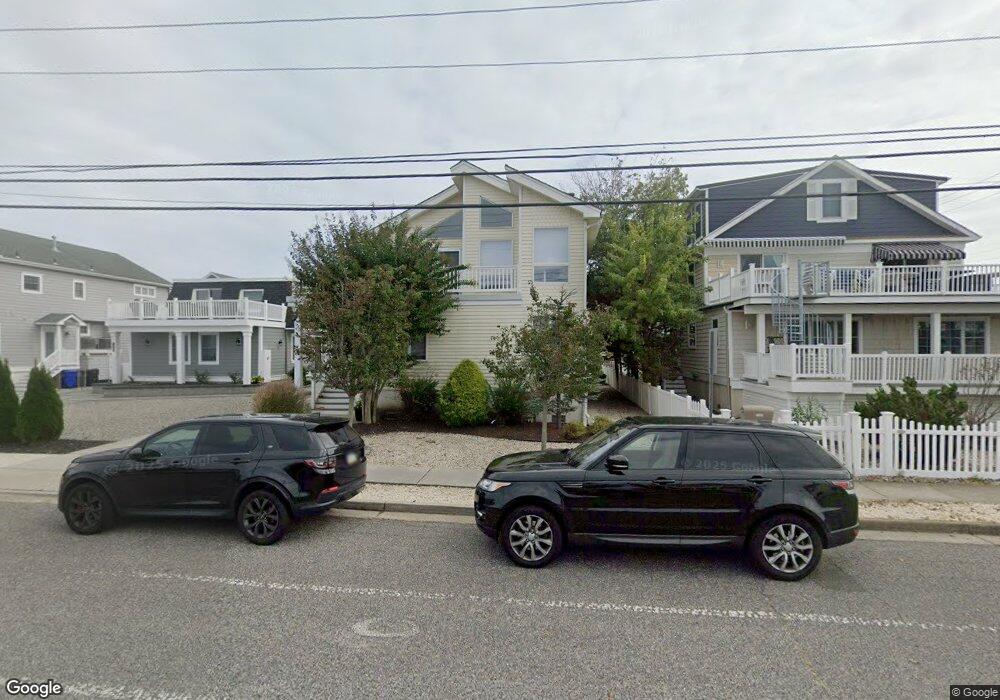
1259 Dune Dr Avalon, NJ 08202
Estimated Value: $2,812,000 - $3,823,000
Studio
--
Bath
3,031
Sq Ft
$1,084/Sq Ft
Est. Value
About This Home
This home is located at 1259 Dune Dr, Avalon, NJ 08202 and is currently estimated at $3,284,882, approximately $1,083 per square foot. 1259 Dune Dr is a home with nearby schools including Avalon Elementary School.
Ownership History
Date
Name
Owned For
Owner Type
Purchase Details
Closed on
Jun 6, 2003
Sold by
Colin Roy N
Bought by
Borneman Bradley A and Borneman Meganne
Current Estimated Value
Home Financials for this Owner
Home Financials are based on the most recent Mortgage that was taken out on this home.
Original Mortgage
$568,000
Outstanding Balance
$248,631
Interest Rate
5.77%
Estimated Equity
$3,036,252
Purchase Details
Closed on
Feb 22, 1993
Sold by
Haryslak Lawrence W and Haryslak Jeani H
Bought by
Colin Roy N and Colin Ann F
Create a Home Valuation Report for This Property
The Home Valuation Report is an in-depth analysis detailing your home's value as well as a comparison with similar homes in the area
Home Values in the Area
Average Home Value in this Area
Purchase History
| Date | Buyer | Sale Price | Title Company |
|---|---|---|---|
| Borneman Bradley A | $709,000 | -- | |
| Colin Roy N | $189,000 | -- |
Source: Public Records
Mortgage History
| Date | Status | Borrower | Loan Amount |
|---|---|---|---|
| Open | Borneman Bradley A | $568,000 |
Source: Public Records
Tax History
| Year | Tax Paid | Tax Assessment Tax Assessment Total Assessment is a certain percentage of the fair market value that is determined by local assessors to be the total taxable value of land and additions on the property. | Land | Improvement |
|---|---|---|---|---|
| 2025 | $11,193 | $1,822,900 | $975,000 | $847,900 |
| 2024 | $11,193 | $1,822,900 | $975,000 | $847,900 |
| 2023 | $11,101 | $1,822,900 | $975,000 | $847,900 |
| 2022 | $10,354 | $1,822,900 | $975,000 | $847,900 |
| 2021 | $9,971 | $1,822,900 | $975,000 | $847,900 |
| 2020 | $9,588 | $1,822,900 | $975,000 | $847,900 |
| 2019 | $9,297 | $1,822,900 | $975,000 | $847,900 |
| 2018 | $8,896 | $1,822,900 | $975,000 | $847,900 |
| 2017 | $7,882 | $1,417,600 | $650,000 | $767,600 |
| 2016 | $7,797 | $1,417,600 | $650,000 | $767,600 |
| 2015 | $7,669 | $650,000 | $650,000 | $0 |
| 2014 | $3,478 | $650,000 | $650,000 | $0 |
Source: Public Records
Map
Nearby Homes
Your Personal Tour Guide
Ask me questions while you tour the home.