126 Boston St Middleton, MA 01949
Estimated Value: $1,012,872 - $1,199,000
About This Home
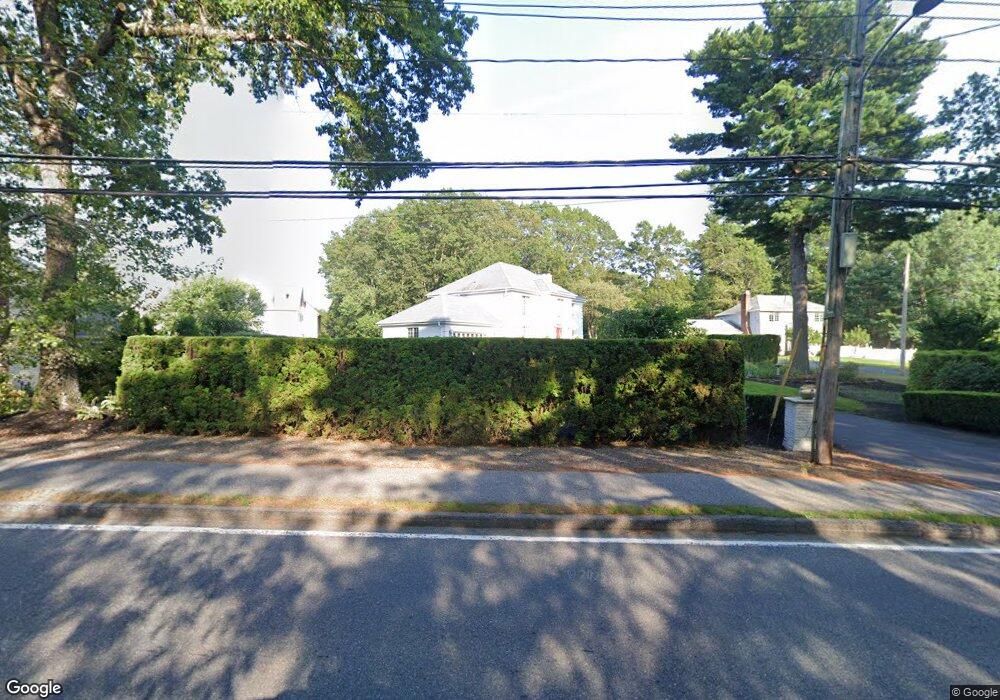
This home is located at 126 Boston St, Middleton, MA 01949 and is currently estimated at $1,091,718, approximately $373 per square foot. 126 Boston St is a home located in Essex County with nearby schools including Howe-Manning Elementary School, Fuller Meadow Elementary School, and Masconomet Regional Middle School.
Ownership History
We collect this data history from publicly available records. To have your information removed, we recommend requesting removal directly through your county’s website.
Purchase Details
Purchase Details
Home Values in the Area
Average Home Value in this Area
Purchase History
We collect this data history from publicly available records. To have your information removed, we recommend requesting removal directly through your county’s website.
| Date | Buyer | Sale Price | Title Company |
|---|---|---|---|
| -- | None Available | ||
| -- | None Available | ||
| -- | None Available | ||
| $86,000 | -- | ||
| $86,000 | -- |
Mortgage History
We collect this data history from publicly available records. To have your information removed, we recommend requesting removal directly through your county’s website.
| Date | Status | Borrower | Loan Amount |
|---|---|---|---|
| Previous Owner | $255,000 | ||
| Previous Owner | $100,000 | ||
| Previous Owner | $10,000 |
Tax History
We collect this data history from publicly available records. To have your information removed, we recommend requesting removal directly through your county’s website.
| Year | Tax Paid | Tax Assessment Tax Assessment Total Assessment is a certain percentage of the fair market value that is determined by local assessors to be the total taxable value of land and additions on the property. | Land | Improvement |
|---|---|---|---|---|
| 2025 | $10,443 | $878,300 | $375,000 | $503,300 |
| 2024 | $9,967 | $845,400 | $348,600 | $496,800 |
| 2023 | $9,268 | $720,100 | $348,600 | $371,500 |
| 2022 | $8,227 | $620,900 | $281,800 | $339,100 |
| 2021 | $7,903 | $576,000 | $249,800 | $326,200 |
| 2020 | $7,898 | $579,900 | $249,800 | $330,100 |
| 2019 | $7,844 | $573,000 | $249,800 | $323,200 |
| 2018 | $7,491 | $536,600 | $224,800 | $311,800 |
| 2017 | $7,128 | $511,000 | $203,400 | $307,600 |
| 2016 | $7,310 | $526,300 | $222,600 | $303,700 |
| 2015 | $6,751 | $489,900 | $189,000 | $300,900 |
Map
- 6 Phaneuf St
- 17 James Ave
- 8 Sgt Roode Ln
- 13 Mills Point Unit 13
- 111 Flint Farm Rd
- 8 Edgewood Rd
- 16 Couture Way
- 110 Flint Farm Rd
- 63 Rowell Ln Unit 63
- 15 Erin Way
- 7 Wedge Ct Unit 7
- 12 Couture Way
- 11 Brassie Way
- 38 N Main St
- 30 Spoon Way
- 1 East St
- 43 Riverside Dr
- 30 Brassie Way Unit 30
- 20 Tarbox Ln
- 19 Glen Dr
- 23 Phaneuf St
- 128 Boston St
- 3 Phaneuf St
- 1 Phaneuf St
- 129 Boston St
- 7 Phaneuf St
- 6 Old Haswell Park Rd
- 130 Boston St
- 127 Boston St Unit 1
- 127 Boston St
- 11 Phaneuf St
- 16 Curtis Ave
- 122 Boston St
- 13 Curtis Ave
- 10 Phaneuf St
- 8 Old Haswell Park Rd
- 131 Boston St
- 13 Phaneuf St
- 2 James Ave
- 3 Old Haswell Park Rd
Ask me questions while you tour the home.