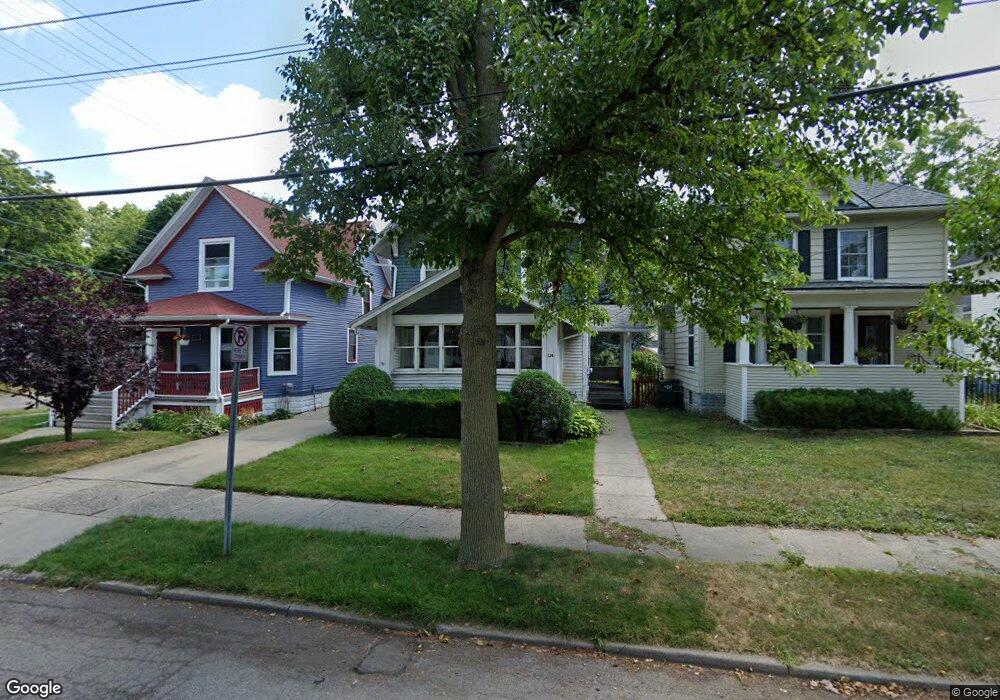
126 Horton St Lansing, MI 48912
Eastfield NeighborhoodEstimated Value: $147,206 - $182,000
Studio
--
Bath
1,452
Sq Ft
$116/Sq Ft
Est. Value
About This Home
This home is located at 126 Horton St, Lansing, MI 48912 and is currently estimated at $167,802, approximately $115 per square foot. 126 Horton St is a home located in Ingham County with nearby schools including Pattengill Academy, Riddle Elementary School, and Eastern High School.
Create a Home Valuation Report for This Property
The Home Valuation Report is an in-depth analysis detailing your home's value as well as a comparison with similar homes in the area
Home Values in the Area
Average Home Value in this Area
Map
Nearby Homes
- 206 N Clemens Ave
- 1713 Stanley Ct
- 227 Marshall St
- 122 Allen St
- 314 Regent St
- 313 N Magnolia Ave
- 300 Allen St Unit 1
- 129 Clifford St
- 334 N Magnolia Ave
- 404 Leslie St
- 213 S Hayford Ave
- 507 N Clemens Ave
- 120 Ferguson St
- 312 S Hayford Ave
- 217 Rosamond St
- 435 Regent St
- 333 N Foster Ave
- 418 S Magnolia Ave
- 504 N Magnolia Ave
- 216 Rosamond St
- 115 Horton St
- 117 Horton St
- 1825 E Michigan Ave
- 121 Horton St
- 1809 Chigan
- 1809 E Michigan Ave
- 123 Horton St
- 125 Horton St
- 1803 E Michigan Ave
- 1901 E Michigan Ave
- 1812 Jerome St
- 1808 Jerome St
- 127 Horton St
- 118 Horton St
- 122 Horton St
- 1804 Jerome St
- 0 Michigan Ave Unit 194072
- 128 Horton St
- 1723 E Michigan Ave
- 1800 Jerome St
Your Personal Tour Guide
Ask me questions while you tour the home.