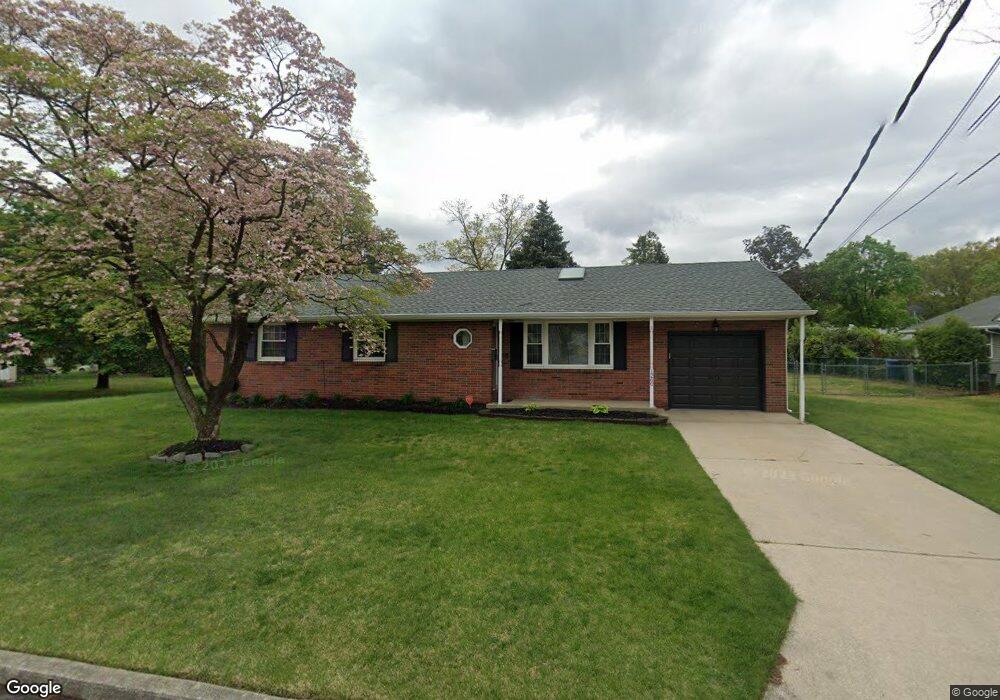
1260 Highview Ave Roebling, NJ 08554
Estimated Value: $366,000 - $389,000
3
Beds
1
Bath
1,182
Sq Ft
$319/Sq Ft
Est. Value
About This Home
This home is located at 1260 Highview Ave, Roebling, NJ 08554 and is currently estimated at $376,907, approximately $318 per square foot. 1260 Highview Ave is a home located in Burlington County with nearby schools including Number 5, Roebling Elementary School, Riverfront Middle School, and Florence Twp Mem High School.
Ownership History
Date
Name
Owned For
Owner Type
Purchase Details
Closed on
Jul 27, 2011
Sold by
Carey Thomas E and Carey Jennifer L
Bought by
Rzomp Matthew
Current Estimated Value
Home Financials for this Owner
Home Financials are based on the most recent Mortgage that was taken out on this home.
Original Mortgage
$191,344
Outstanding Balance
$130,491
Interest Rate
4.25%
Mortgage Type
FHA
Estimated Equity
$246,416
Purchase Details
Closed on
Mar 23, 2001
Sold by
Chanti Geraldine
Bought by
Carey Thomas E
Home Financials for this Owner
Home Financials are based on the most recent Mortgage that was taken out on this home.
Original Mortgage
$128,950
Interest Rate
6.97%
Mortgage Type
FHA
Create a Home Valuation Report for This Property
The Home Valuation Report is an in-depth analysis detailing your home's value as well as a comparison with similar homes in the area
Home Values in the Area
Average Home Value in this Area
Purchase History
| Date | Buyer | Sale Price | Title Company |
|---|---|---|---|
| Rzomp Matthew | $196,750 | First American Title Ins Co | |
| Carey Thomas E | $130,000 | -- |
Source: Public Records
Mortgage History
| Date | Status | Borrower | Loan Amount |
|---|---|---|---|
| Open | Rzomp Matthew | $191,344 | |
| Previous Owner | Carey Thomas E | $128,950 |
Source: Public Records
Tax History
| Year | Tax Paid | Tax Assessment Tax Assessment Total Assessment is a certain percentage of the fair market value that is determined by local assessors to be the total taxable value of land and additions on the property. | Land | Improvement |
|---|---|---|---|---|
| 2025 | $7,238 | $259,700 | $102,500 | $157,200 |
| 2024 | $6,929 | $259,700 | $102,500 | $157,200 |
| 2023 | $6,929 | $259,700 | $102,500 | $157,200 |
| 2022 | $6,781 | $259,700 | $102,500 | $157,200 |
| 2021 | $6,721 | $259,700 | $102,500 | $157,200 |
| 2020 | $6,695 | $259,700 | $102,500 | $157,200 |
| 2019 | $6,635 | $259,700 | $102,500 | $157,200 |
| 2018 | $6,578 | $259,700 | $102,500 | $157,200 |
| 2017 | $6,498 | $259,700 | $102,500 | $157,200 |
| 2016 | $6,373 | $259,700 | $102,500 | $157,200 |
| 2015 | $6,243 | $259,700 | $102,500 | $157,200 |
| 2014 | $6,069 | $259,700 | $102,500 | $157,200 |
Source: Public Records
Map
Nearby Homes
- 1250 Highview Ave
- 301 Parrish Ln
- 1251 Maple Ave
- 1271 Maple Ave
- 1277 Highview Ave
- 1230 Highview Ave
- 1273 Highview Ave
- 1265 Highview Ave
- 1245 Highview Ave
- 339 Parrish Ln
- 1231 Maple Ave
- 1295 Highview Ave
- 1243 Highview Ave
- 100 Parrish Ln
- 1274 Emerick Ave
- 310 Station Rd
- 1250 Emerick Ave
- 1241 Highview Ave
- 300 Station Rd
- 1240 Emerick Ave
Your Personal Tour Guide
Ask me questions while you tour the home.