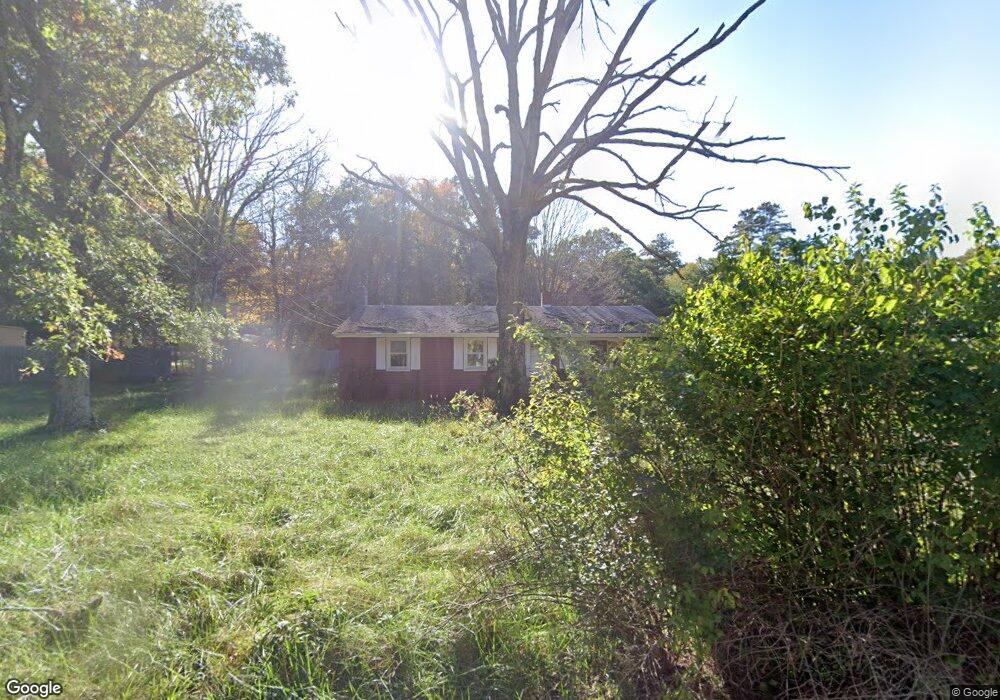
127 Chewink Rd Chaplin, CT 06235
Estimated Value: $228,000 - $263,000
3
Beds
1
Bath
1,008
Sq Ft
$247/Sq Ft
Est. Value
About This Home
This home is located at 127 Chewink Rd, Chaplin, CT 06235 and is currently estimated at $248,812, approximately $246 per square foot. 127 Chewink Rd is a home located in Windham County with nearby schools including Chaplin Elementary School and Parish Hill High School.
Ownership History
Date
Name
Owned For
Owner Type
Purchase Details
Closed on
Aug 15, 2018
Sold by
Becon Elaine M
Bought by
As Preferred Invetment
Current Estimated Value
Purchase Details
Closed on
Nov 26, 2008
Sold by
Bacon Todd R
Bought by
Bacon Elaine M
Home Financials for this Owner
Home Financials are based on the most recent Mortgage that was taken out on this home.
Original Mortgage
$115,000
Interest Rate
6.47%
Purchase Details
Closed on
Jan 26, 2004
Sold by
Department Of Housing & Urban Dev
Bought by
Bacon Todd
Home Financials for this Owner
Home Financials are based on the most recent Mortgage that was taken out on this home.
Original Mortgage
$97,000
Interest Rate
5.89%
Purchase Details
Closed on
Nov 27, 2000
Sold by
Burrill Carroll
Bought by
Shear Scot A
Create a Home Valuation Report for This Property
The Home Valuation Report is an in-depth analysis detailing your home's value as well as a comparison with similar homes in the area
Home Values in the Area
Average Home Value in this Area
Purchase History
| Date | Buyer | Sale Price | Title Company |
|---|---|---|---|
| As Preferred Invetment | -- | -- | |
| Bacon Elaine M | $7,000 | -- | |
| Bacon Todd | $100,000 | -- | |
| Shear Scot A | $105,000 | -- | |
| Preferred Invetment As | -- | -- | |
| Bacon Elaine M | $7,000 | -- | |
| Bacon Todd | $100,000 | -- | |
| Shear Scot A | $105,000 | -- |
Source: Public Records
Mortgage History
| Date | Status | Borrower | Loan Amount |
|---|---|---|---|
| Previous Owner | Shear Scot A | $115,000 | |
| Previous Owner | Shear Scot A | $97,000 |
Source: Public Records
Tax History
| Year | Tax Paid | Tax Assessment Tax Assessment Total Assessment is a certain percentage of the fair market value that is determined by local assessors to be the total taxable value of land and additions on the property. | Land | Improvement |
|---|---|---|---|---|
| 2025 | $3,822 | $121,800 | $30,100 | $91,700 |
| 2024 | $3,648 | $121,800 | $30,100 | $91,700 |
| 2023 | $3,532 | $99,500 | $26,500 | $73,000 |
| 2022 | $3,433 | $99,500 | $26,500 | $73,000 |
| 2021 | $3,234 | $99,500 | $26,500 | $73,000 |
| 2020 | $3,234 | $99,500 | $26,500 | $73,000 |
| 2019 | $3,234 | $99,500 | $26,500 | $73,000 |
| 2018 | $3,211 | $98,800 | $26,500 | $72,300 |
| 2017 | $3,463 | $98,800 | $26,500 | $72,300 |
| 2016 | $3,463 | $98,800 | $26,500 | $72,300 |
| 2015 | $3,606 | $98,800 | $26,500 | $72,300 |
| 2014 | $3,606 | $98,800 | $26,500 | $72,300 |
Source: Public Records
Map
Nearby Homes
- 81 Chappell St
- 0 Hampton Rd Unit 170523717
- 0 Scotland Rd Unit 24160798
- 11 Mountain Laurel Ln
- 00 N Brook St
- 222 Parish Hill Rd
- 13 Bates Rd
- 771 Brook Rd
- 769 Brook Rd
- 366 Hartford Turnpike
- 69 N Bedlam Rd
- 890 Brook Rd
- 404 Bassetts Bridge Rd
- 512 Brook Rd
- 368 Warrenville Rd
- 0 Providence Turnpike Unit 24160702
- 6 Skyline Dr
- 3 Elizabeth Ln
- 16 Circle Dr
- 64 Circle Dr
Your Personal Tour Guide
Ask me questions while you tour the home.