Estimated Value: $355,000 - $411,000
4
Beds
2
Baths
2,094
Sq Ft
$181/Sq Ft
Est. Value
About This Home
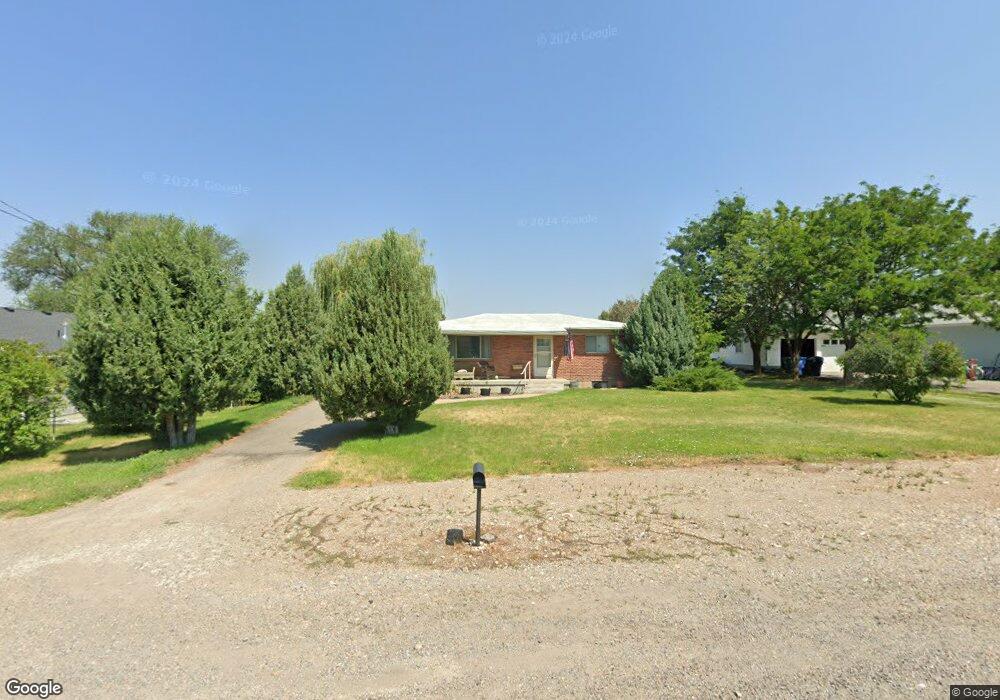
This home is located at 127 E 300 S, Hyrum, UT 84319 and is currently estimated at $379,889, approximately $181 per square foot. 127 E 300 S is a home located in Cache County with nearby schools including Lincoln School, South Cache Middle School, and Mountain Crest High School.
Ownership History
Date
Name
Owned For
Owner Type
Purchase Details
Closed on
Oct 23, 2017
Sold by
Edwards Daniel Todd and Edwards Sherry Lynne
Bought by
Watts Collen Sue
Current Estimated Value
Home Financials for this Owner
Home Financials are based on the most recent Mortgage that was taken out on this home.
Original Mortgage
$167,920
Outstanding Balance
$139,961
Interest Rate
3.83%
Mortgage Type
New Conventional
Estimated Equity
$239,928
Purchase Details
Closed on
Jun 19, 2017
Sold by
Wonderful Life Properties Llc
Bought by
Edwards Daniel Todd and Edwards Sherry Lynne
Purchase Details
Closed on
Mar 24, 2017
Sold by
Edwards Daniel Todd and Edwards Sherry Lynne
Bought by
Wonderful Life Properties Llc
Purchase Details
Closed on
Jun 15, 2016
Sold by
Swanson Gary P and Swanson Buford Scott
Bought by
Edwards Daniel Todd and Edwards Sherry Lynne
Create a Home Valuation Report for This Property
The Home Valuation Report is an in-depth analysis detailing your home's value as well as a comparison with similar homes in the area
Home Values in the Area
Average Home Value in this Area
Purchase History
We collect this data history from publicly available records. To have your information removed, we recommend requesting removal directly through your county’s website.
| Date | Buyer | Sale Price | Title Company |
|---|---|---|---|
| Watts Collen Sue | -- | -- | |
| Edwards Daniel Todd | -- | Heritage Title | |
| Wonderful Life Properties Llc | -- | Heritage Title | |
| Edwards Daniel Todd | -- | Heritage Title |
Source: Public Records
Mortgage History
We collect this data history from publicly available records. To have your information removed, we recommend requesting removal directly through your county’s website.
| Date | Status | Borrower | Loan Amount |
|---|---|---|---|
| Open | Watts Collen Sue | $167,920 |
Source: Public Records
Tax History
| Year | Tax Paid | Tax Assessment Tax Assessment Total Assessment is a certain percentage of the fair market value that is determined by local assessors to be the total taxable value of land and additions on the property. | Land | Improvement |
|---|---|---|---|---|
| 2025 | $1,313 | $188,445 | $0 | $0 |
| 2024 | $1,399 | $187,540 | $0 | $0 |
| 2023 | $1,460 | $187,240 | $0 | $0 |
| 2022 | $1,720 | $211,260 | $0 | $0 |
| 2021 | $1,592 | $301,390 | $65,050 | $236,340 |
| 2020 | $1,390 | $246,850 | $65,050 | $181,800 |
| 2019 | $1,312 | $219,120 | $37,320 | $181,800 |
| 2018 | $1,047 | $169,032 | $37,320 | $131,712 |
| 2017 | $1,075 | $90,085 | $0 | $0 |
| 2016 | $1,099 | $73,150 | $0 | $0 |
| 2015 | $895 | $73,150 | $0 | $0 |
| 2014 | $873 | $72,990 | $0 | $0 |
| 2013 | -- | $67,675 | $0 | $0 |
Source: Public Records
Map
Nearby Homes
Your Personal Tour Guide
Ask me questions while you tour the home.