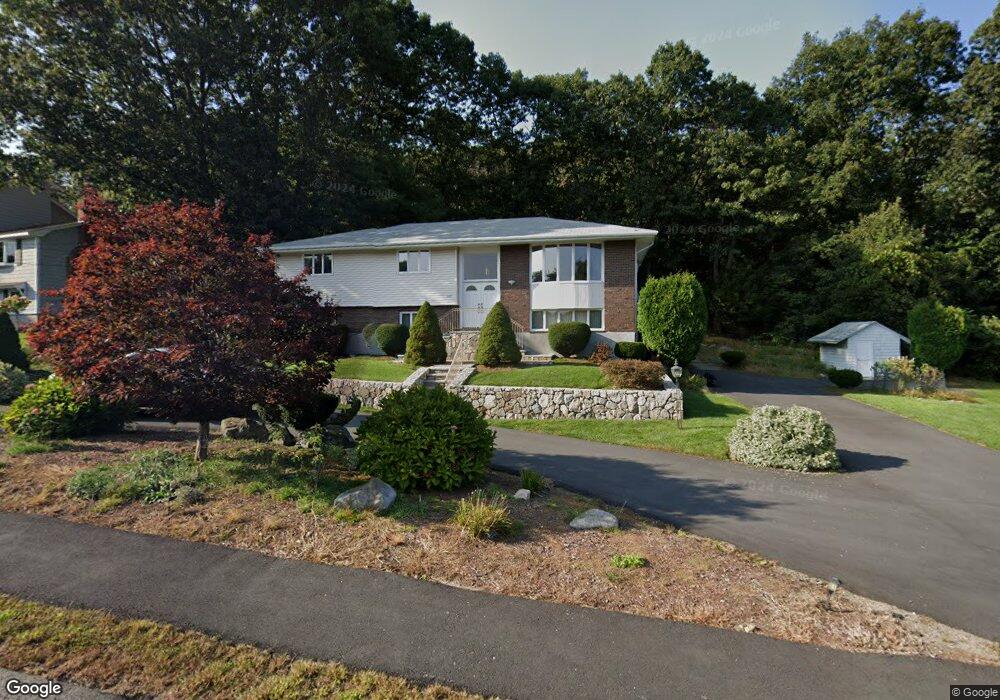
127 Johnson Rd Winchester, MA 01890
West Side NeighborhoodEstimated Value: $1,305,086 - $1,586,000
3
Beds
3
Baths
2,765
Sq Ft
$531/Sq Ft
Est. Value
About This Home
This home is located at 127 Johnson Rd, Winchester, MA 01890 and is currently estimated at $1,467,522, approximately $530 per square foot. 127 Johnson Rd is a home located in Middlesex County with nearby schools including Vinson-Owen Elementary School, McCall Middle School, and Winchester High School.
Ownership History
Date
Name
Owned For
Owner Type
Purchase Details
Closed on
Jul 25, 1984
Bought by
Stepanian Krikor and Stepanian Armine
Current Estimated Value
Create a Home Valuation Report for This Property
The Home Valuation Report is an in-depth analysis detailing your home's value as well as a comparison with similar homes in the area
Home Values in the Area
Average Home Value in this Area
Purchase History
We collect this data history from publicly available records. To have your information removed, we recommend requesting removal directly through your county’s website.
| Date | Buyer | Sale Price | Title Company |
|---|---|---|---|
| Stepanian Krikor | $162,500 | -- |
Source: Public Records
Mortgage History
We collect this data history from publicly available records. To have your information removed, we recommend requesting removal directly through your county’s website.
| Date | Status | Borrower | Loan Amount |
|---|---|---|---|
| Open | Stepanian Krikor | $150,000 | |
| Closed | Stepanian Krikor | $173,000 | |
| Closed | Stepanian Krikor | $135,000 |
Source: Public Records
Tax History
| Year | Tax Paid | Tax Assessment Tax Assessment Total Assessment is a certain percentage of the fair market value that is determined by local assessors to be the total taxable value of land and additions on the property. | Land | Improvement |
|---|---|---|---|---|
| 2025 | $126 | $1,134,500 | $801,000 | $333,500 |
| 2024 | $12,381 | $1,092,800 | $761,000 | $331,800 |
| 2023 | $11,117 | $942,100 | $661,000 | $281,100 |
| 2022 | $10,993 | $878,700 | $600,900 | $277,800 |
| 2021 | $9,770 | $798,700 | $520,900 | $277,800 |
| 2020 | $9,596 | $788,700 | $510,900 | $277,800 |
| 2019 | $8,946 | $738,700 | $460,900 | $277,800 |
| 2018 | $8,687 | $712,600 | $438,900 | $273,700 |
| 2017 | $8,581 | $698,800 | $438,900 | $259,900 |
| 2016 | $8,069 | $690,800 | $430,900 | $259,900 |
| 2015 | $7,782 | $641,000 | $400,900 | $240,100 |
| 2014 | $7,894 | $623,500 | $390,900 | $232,600 |
Source: Public Records
Map
Nearby Homes
- 276 High St
- 12 Cox Rd
- 105 Thornberry Rd
- 14 Nassau Dr
- 15 Gershon Way Unit 15
- 7 Whipple Rd
- 22 Tyler Rd
- 16 Winchester Dr
- 13 Paddock Ln Unit 13
- 37 Mayflower Rd
- 1 Plymouth Rd
- 8 Hawthorne Rd
- 20 Amberwood Dr
- 15 Summer St
- 281 Forest St
- 140 Madison Ave Unit 140
- 38 Waltham St
- 93 Crescent Hill Ave
- 845 Emerson Gardens Rd
- 52 Albemarle Ave
- 131 Johnson Rd
- 125 Johnson Rd
- 126 Johnson Rd
- 133 Johnson Rd
- 89 Thornberry Rd
- 87 Thornberry Rd
- 123 Johnson Rd
- 122 Johnson Rd
- 85 Thornberry Rd
- 91 Thornberry Rd
- 121 Johnson Rd
- 135 Johnson Rd
- 86 Thornberry Rd
- 88 Thornberry Rd
- 84 Thornberry Rd
- 83 Thornberry Rd
- 282 High St
- 282 High St Unit n/a
- 282 High St Unit R
- 282 High St Unit 282
Your Personal Tour Guide
Ask me questions while you tour the home.