127 Norman St Chicopee, MA 01013
Willimansett NeighborhoodEstimated Value: $315,693 - $361,000
3
Beds
2
Baths
1,622
Sq Ft
$208/Sq Ft
Est. Value
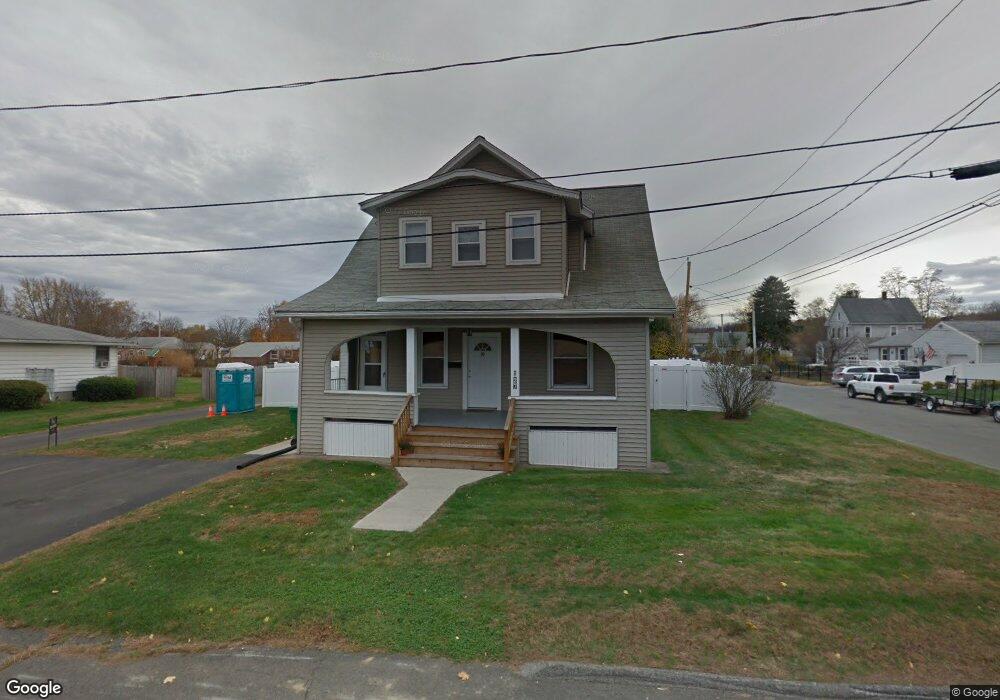
About This Home
This home is located at 127 Norman St, Chicopee, MA 01013 and is currently estimated at $336,923, approximately $207 per square foot. 127 Norman St is a home located in Hampden County with nearby schools including Fairview Elementary School, Bellamy Middle School, and Chicopee High School.
Ownership History
Date
Name
Owned For
Owner Type
Purchase Details
Closed on
Feb 9, 2024
Sold by
Munkittrick Erik M
Bought by
Munkittrick Erik M and Austin Kalyn B
Current Estimated Value
Purchase Details
Closed on
Apr 18, 2017
Sold by
Munkittrick Raymond L
Bought by
Munkittrick Erik M
Purchase Details
Closed on
Aug 29, 2013
Sold by
Munkittrick Raymond L
Bought by
Munkittrick Erin M
Create a Home Valuation Report for This Property
The Home Valuation Report is an in-depth analysis detailing your home's value as well as a comparison with similar homes in the area
Home Values in the Area
Average Home Value in this Area
Purchase History
We collect this data history from publicly available records. To have your information removed, we recommend requesting removal directly through your county’s website.
| Date | Buyer | Sale Price | Title Company |
|---|---|---|---|
| Munkittrick Erik M | -- | None Available | |
| Munkittrick Erik M | -- | -- | |
| Munkittrick Erin M | -- | -- |
Source: Public Records
Tax History
| Year | Tax Paid | Tax Assessment Tax Assessment Total Assessment is a certain percentage of the fair market value that is determined by local assessors to be the total taxable value of land and additions on the property. | Land | Improvement |
|---|---|---|---|---|
| 2025 | $4,031 | $265,900 | $101,100 | $164,800 |
| 2024 | $3,821 | $258,900 | $99,100 | $159,800 |
| 2023 | $3,580 | $236,300 | $90,000 | $146,300 |
| 2022 | $3,417 | $201,100 | $78,300 | $122,800 |
| 2021 | $3,221 | $182,900 | $71,200 | $111,700 |
| 2020 | $3,064 | $175,500 | $71,200 | $104,300 |
| 2019 | $3,082 | $171,600 | $71,200 | $100,400 |
| 2018 | $2,985 | $163,000 | $67,800 | $95,200 |
| 2017 | $3,071 | $177,400 | $67,800 | $109,600 |
| 2016 | $2,513 | $148,600 | $67,800 | $80,800 |
| 2015 | $2,715 | $154,800 | $67,800 | $87,000 |
| 2014 | $1,270 | $154,800 | $67,800 | $87,000 |
Source: Public Records
Map
Nearby Homes
- 958 Main St
- 38 Whitman St
- 5 Vernon St
- 109-111 Brown Ave
- 2129 Northampton St
- 40 Laurel St
- 94 Cora Ave
- 55 Empire St Unit 10
- 90 Mckinstry Ave Unit 106
- 90 Mckinstry Ave Unit 303
- 95 Wedgewood Terrace
- 3 Park View Terrace Unit 3
- 60 Chapin St Unit D
- 680 S East St
- 2 Oscar St
- 632 S East St
- 85-87 Hitchcock St
- 44 Lower Westfield Rd
- 1825 Northampton St
- 36 Queen St
Your Personal Tour Guide
Ask me questions while you tour the home.