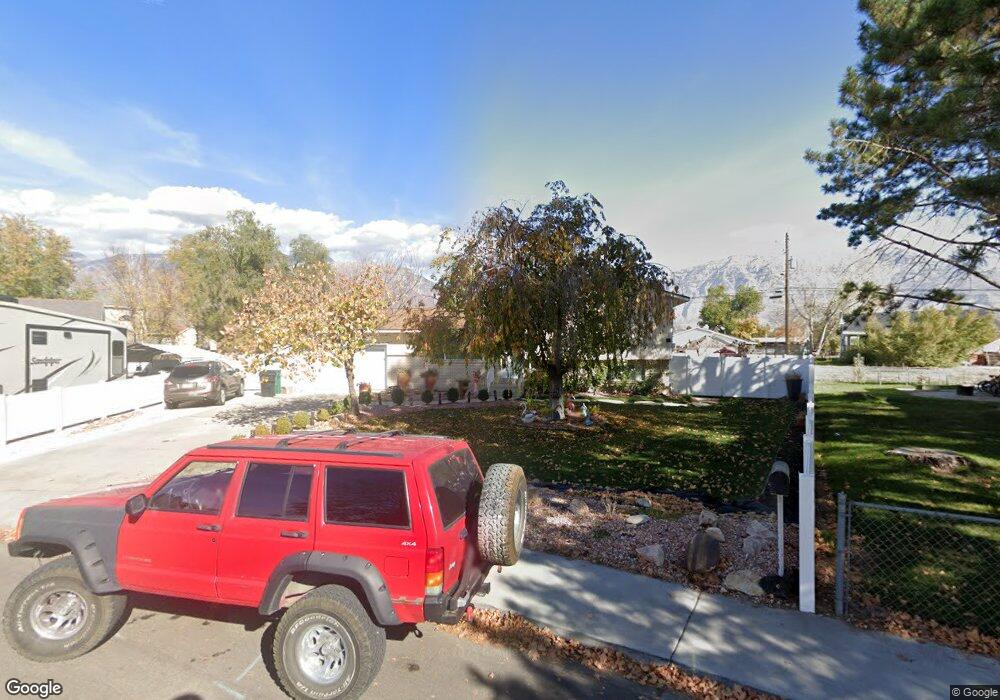
128 N 850 W Orem, UT 84057
Suncrest NeighborhoodEstimated Value: $485,000 - $534,000
5
Beds
2
Baths
2,060
Sq Ft
$248/Sq Ft
Est. Value
About This Home
This home is located at 128 N 850 W, Orem, UT 84057 and is currently estimated at $509,925, approximately $247 per square foot. 128 N 850 W is a home located in Utah County with nearby schools including Orem Junior High School, Mountain View High School, and Noah Webster Academy.
Ownership History
Date
Name
Owned For
Owner Type
Purchase Details
Closed on
Oct 27, 2016
Sold by
Paystonup Carl L and Paystonup Catherine W
Bought by
Chavez Alcala Farel
Current Estimated Value
Home Financials for this Owner
Home Financials are based on the most recent Mortgage that was taken out on this home.
Original Mortgage
$242,250
Outstanding Balance
$194,485
Interest Rate
3.42%
Mortgage Type
New Conventional
Estimated Equity
$315,440
Purchase Details
Closed on
Oct 8, 2001
Sold by
Paystrup Carl L and Paystrup Catherine
Bought by
Paystrup Carl L and Paystrup Catherine W
Create a Home Valuation Report for This Property
The Home Valuation Report is an in-depth analysis detailing your home's value as well as a comparison with similar homes in the area
Home Values in the Area
Average Home Value in this Area
Purchase History
| Date | Buyer | Sale Price | Title Company |
|---|---|---|---|
| Chavez Alcala Farel | -- | Inwest Title | |
| Paystrup Carl L | -- | -- |
Source: Public Records
Mortgage History
| Date | Status | Borrower | Loan Amount |
|---|---|---|---|
| Open | Chavez Alcala Farel | $242,250 |
Source: Public Records
Tax History
| Year | Tax Paid | Tax Assessment Tax Assessment Total Assessment is a certain percentage of the fair market value that is determined by local assessors to be the total taxable value of land and additions on the property. | Land | Improvement |
|---|---|---|---|---|
| 2025 | $1,912 | $257,290 | -- | -- |
| 2024 | $1,912 | $233,750 | $0 | $0 |
| 2023 | $1,757 | $230,945 | $0 | $0 |
| 2022 | $1,770 | $225,390 | $0 | $0 |
| 2021 | $1,587 | $306,000 | $128,000 | $178,000 |
| 2020 | $1,452 | $275,200 | $102,400 | $172,800 |
| 2019 | $1,356 | $267,300 | $102,400 | $164,900 |
| 2018 | $1,263 | $237,900 | $94,500 | $143,400 |
| 2017 | $1,179 | $118,910 | $0 | $0 |
| 2016 | $1,067 | $99,275 | $0 | $0 |
| 2015 | $1,001 | $88,055 | $0 | $0 |
| 2014 | $928 | $81,235 | $0 | $0 |
Source: Public Records
Map
Nearby Homes
- 896 W 30 S
- 45 N 970 W
- 565 W 40 N
- 222 N 1200 W Unit 144
- 222 N 1200 W Unit 53
- 222 N 1200 W Unit 84
- 508 W 40 N
- 489 N Beverly Ave
- 510 N 940 W
- 162 N 450 W Unit 2
- 474 N Emery Ave
- 875 W 530 N
- 155 S 1200 W Unit 69
- 155 S 1200 W Unit 6
- 155 S 1200 W Unit 97
- 237 S Ridgeview Dr
- 1094 W 465 N
- 224 N 400 W Unit 3
- 557 N Emery Ave
- 454 N 1235 W
Your Personal Tour Guide
Ask me questions while you tour the home.