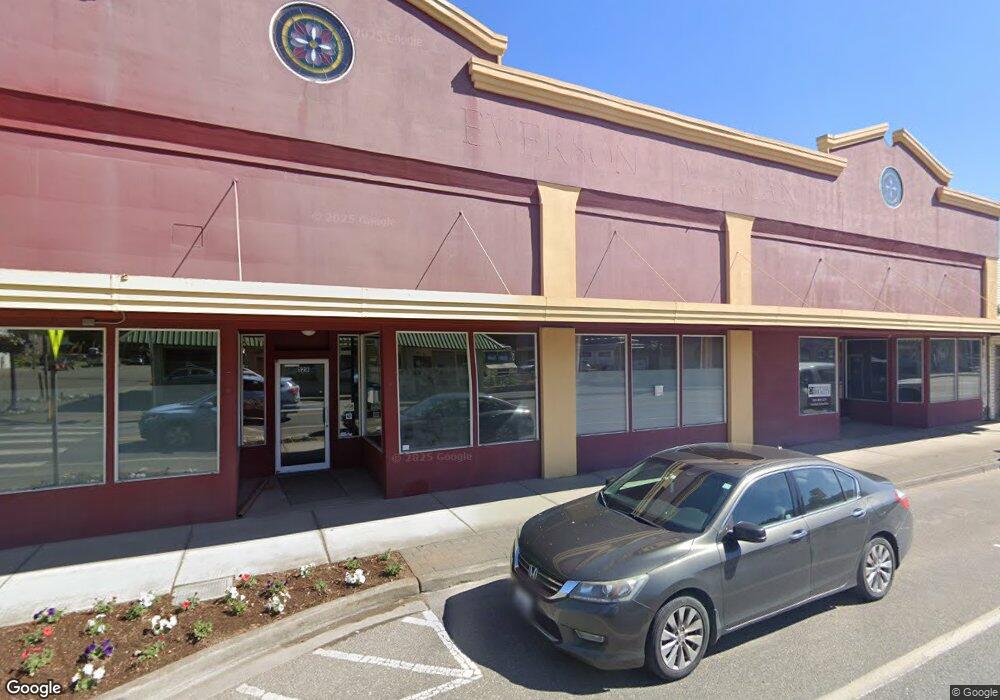
128 W Main St Everson, WA 98247
Estimated Value: $506,183
Studio
--
Bath
11,516
Sq Ft
$44/Sq Ft
Est. Value
About This Home
This home is located at 128 W Main St, Everson, WA 98247 and is currently estimated at $506,183, approximately $43 per square foot. 128 W Main St is a home located in Whatcom County with nearby schools including Everson Elementary School, Nooksack Elementary School, and Sumas Elementary School.
Ownership History
Date
Name
Owned For
Owner Type
Purchase Details
Closed on
Mar 8, 2013
Sold by
Blakeway Karen G
Bought by
Syb Investment Co Inc
Current Estimated Value
Home Financials for this Owner
Home Financials are based on the most recent Mortgage that was taken out on this home.
Original Mortgage
$150,000
Outstanding Balance
$104,705
Interest Rate
3.53%
Mortgage Type
Commercial
Estimated Equity
$401,478
Purchase Details
Closed on
Jul 15, 2011
Sold by
Bennett Ronald D and Bennett Marilyn J
Bought by
Estate Of H Goldie Leenders
Purchase Details
Closed on
Feb 27, 2007
Sold by
Ron & Marilyn Bennett Llc
Bought by
Bennett Ron and Bennett Marilyn
Purchase Details
Closed on
Nov 1, 2005
Sold by
Bennett Ron and Bennett Marilyn
Bought by
Ron & Marilyn Bennett Llc
Purchase Details
Closed on
Nov 25, 2003
Sold by
Leenders Ralph and Goldie Leenders H
Bought by
Bennett Ron and Bennett Marilyn
Purchase Details
Closed on
Jun 7, 2002
Sold by
Bateman Robert J and Bateman Cynthia M
Bought by
Leenders Ralph and Leenders Goldie
Create a Home Valuation Report for This Property
The Home Valuation Report is an in-depth analysis detailing your home's value as well as a comparison with similar homes in the area
Home Values in the Area
Average Home Value in this Area
Purchase History
We collect this data history from publicly available records. To have your information removed, we recommend requesting removal directly through your county’s website.
| Date | Buyer | Sale Price | Title Company |
|---|---|---|---|
| Syb Investment Co Inc | $200,280 | Whatcom Land Title | |
| Syb Investment Co Inc | $200,280 | Whatcom Land Title | |
| Estate Of H Goldie Leenders | $304,044 | None Available | |
| Estate Of H Goldie Leenders | $304,044 | None Available | |
| Bennett Ron | -- | None Available | |
| Bennett Ron | -- | None Available | |
| Ron & Marilyn Bennett Llc | -- | -- | |
| Ron & Marilyn Bennett Llc | -- | -- | |
| Bennett Ron | -- | First American Title Insuran | |
| Bennett Ron | -- | First American Title Insuran | |
| Leenders Ralph | $142,000 | -- | |
| Leenders Ralph | $142,000 | -- |
Source: Public Records
Mortgage History
We collect this data history from publicly available records. To have your information removed, we recommend requesting removal directly through your county’s website.
| Date | Status | Borrower | Loan Amount |
|---|---|---|---|
| Open | Syb Investment Co Inc | $150,000 |
Source: Public Records
Tax History
| Year | Tax Paid | Tax Assessment Tax Assessment Total Assessment is a certain percentage of the fair market value that is determined by local assessors to be the total taxable value of land and additions on the property. | Land | Improvement |
|---|---|---|---|---|
| 2025 | $4,036 | $389,310 | $138,679 | $250,631 |
| 2024 | $3,484 | $437,346 | $134,640 | $302,706 |
| 2023 | $3,484 | $387,907 | $117,128 | $270,779 |
| 2022 | $3,535 | $387,907 | $117,128 | $270,779 |
| 2021 | $4,016 | $320,584 | $96,800 | $223,784 |
| 2020 | $3,856 | $320,584 | $96,800 | $223,784 |
| 2019 | $3,403 | $320,584 | $96,800 | $223,784 |
| 2018 | $4,470 | $320,584 | $96,800 | $223,784 |
| 2017 | $4,332 | $314,081 | $90,024 | $224,057 |
| 2016 | $4,313 | $314,081 | $90,024 | $224,057 |
| 2015 | $3,685 | $314,081 | $90,024 | $224,057 |
| 2014 | -- | $307,020 | $88,000 | $219,020 |
| 2013 | -- | $307,020 | $88,000 | $219,020 |
Source: Public Records
Map
Nearby Homes
- 0 Walnut Grove Ct
- 108 Baker St Unit 1-4
- 110 Baker St Unit A & B
- 208 W 4th St
- 413 W 4th St
- 212 W 4th St
- 405 W 4th St
- 417 W 4th St
- 408 W 3rd St
- 416 W 3rd St
- 308 Baker St
- 501 Shuksan Way
- 301 Christopher Ln
- 107 Thendara Park Dr Unit C
- 502 Westview Place
- 506 Amareen Ct
- 616 Strandell St
- 109 W 2nd St
- 403 Westview Place
- 313 W 3rd St
Your Personal Tour Guide
Ask me questions while you tour the home.