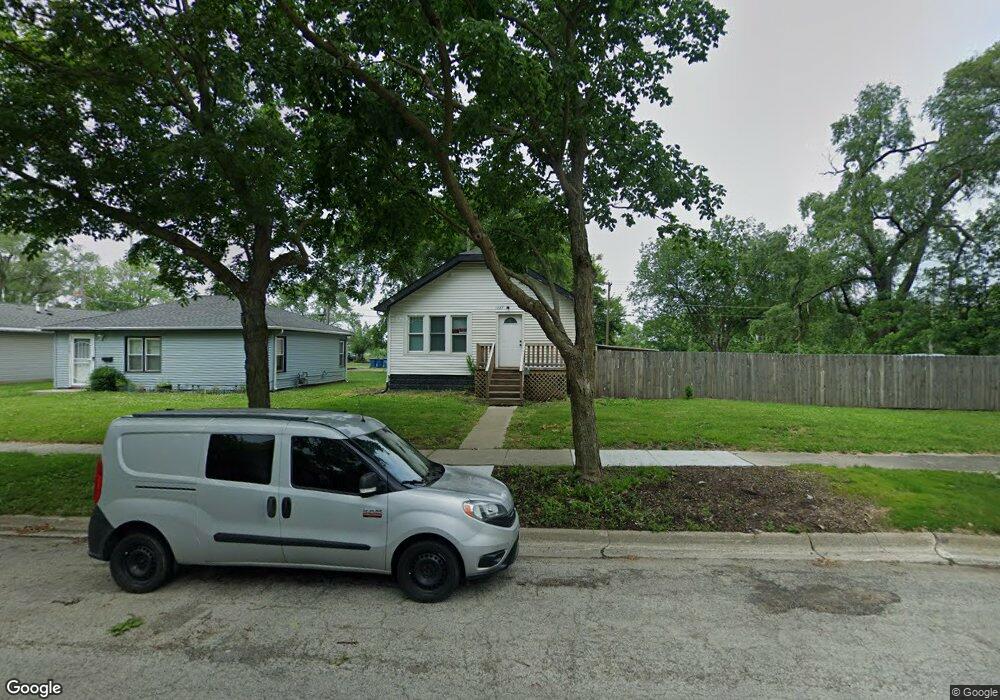
1287 E Chestnut St Kankakee, IL 60901
Estimated Value: $98,000
2
Beds
1
Bath
780
Sq Ft
$126/Sq Ft
Est. Value
About This Home
This home is located at 1287 E Chestnut St, Kankakee, IL 60901 and is currently priced at $98,000, approximately $125 per square foot. 1287 E Chestnut St is a home located in Kankakee County with nearby schools including King Middle Grade School, Edison Primary School, and Kankakee Junior High School.
Ownership History
Date
Name
Owned For
Owner Type
Purchase Details
Closed on
Dec 2, 2021
Sold by
Bt Properties Of Vermilion County Llc
Bought by
Ramirez Oscar
Current Estimated Value
Home Financials for this Owner
Home Financials are based on the most recent Mortgage that was taken out on this home.
Original Mortgage
$11,000
Interest Rate
3.11%
Mortgage Type
New Conventional
Purchase Details
Closed on
Sep 15, 2021
Sold by
County Clerk Of County Of Kankakee
Bought by
Bt Properties Of Vermilion County Llc
Purchase Details
Closed on
Jun 15, 2012
Sold by
Federal Natl Mtg Assn Fnma
Bought by
Homestar Bk & Fncl Serv Tr 1599
Create a Home Valuation Report for This Property
The Home Valuation Report is an in-depth analysis detailing your home's value as well as a comparison with similar homes in the area
Home Values in the Area
Average Home Value in this Area
Purchase History
| Date | Buyer | Sale Price | Title Company |
|---|---|---|---|
| Ramirez Oscar | $13,000 | None Listed On Document | |
| Bt Properties Of Vermilion County Llc | -- | None Listed On Document | |
| Homestar Bk & Fncl Serv Tr 1599 | -- | Attorney Only |
Source: Public Records
Mortgage History
| Date | Status | Borrower | Loan Amount |
|---|---|---|---|
| Previous Owner | Ramirez Oscar | $11,000 |
Source: Public Records
Tax History
| Year | Tax Paid | Tax Assessment Tax Assessment Total Assessment is a certain percentage of the fair market value that is determined by local assessors to be the total taxable value of land and additions on the property. | Land | Improvement |
|---|---|---|---|---|
| 2023 | $2,134 | $16,444 | $903 | $15,541 |
| 2022 | $1,956 | $14,393 | $790 | $13,603 |
| 2021 | $1,846 | $13,025 | $715 | $12,310 |
| 2020 | $1,712 | $11,708 | $643 | $11,065 |
| 2019 | $1,632 | $10,891 | $598 | $10,293 |
| 2018 | $1,572 | $10,085 | $554 | $9,531 |
| 2017 | $1,760 | $9,863 | $542 | $9,321 |
| 2016 | $1,649 | $9,669 | $531 | $9,138 |
| 2015 | $1,593 | $9,866 | $542 | $9,324 |
| 2014 | $1,535 | $9,866 | $542 | $9,324 |
| 2013 | -- | $10,278 | $565 | $9,713 |
Source: Public Records
Map
Nearby Homes
- 1221 E Chestnut St
- 1295 E Merchant St
- 201 N Cottage Ave
- 345 N Wildwood Ave
- 23-26 Illinois Ave
- 215 N Rosewood Ave
- 470 N Greenwood Ave
- 439 Country Club Dr
- 139 S Greenwood Ave
- 396 S Wildwood Ave
- 459 S Nelson Ave
- 357 S Rosewood Ave
- 469 S Wildwood Ave
- 540 S Osborn Ave
- 860 E Bourbonnais St
- 1939 E Spruce St
- 838 N Rosewood Ave
- 369 S Chicago Ave
- 657 S Poplar Ave
- 725 N Webster Cir E
- 1277 E Chestnut St
- 1290 E Chestnut St
- 1296 E Chestnut St
- 1265 E Chestnut St
- 1264 E Chestnut St
- 1286 E Chestnut St
- 1303 E Chestnut St
- 1282 E Chestnut St
- 1257 E Chestnut St
- 1245 E Chestnut St
- 1313 E Chestnut St
- 1256 E Chestnut St
- 1244 E Chestnut St
- 1268 E Locust St
- 1282 E Locust St
- 1235 E Chestnut St
- 1272 E Locust St
- 1323 E Chestnut St
- 1264 E Locust St
- 1312 E Chestnut St
Your Personal Tour Guide
Ask me questions while you tour the home.