Estimated Value: $167,875 - $201,000
5
Beds
4
Baths
3,262
Sq Ft
$55/Sq Ft
Est. Value
About This Home
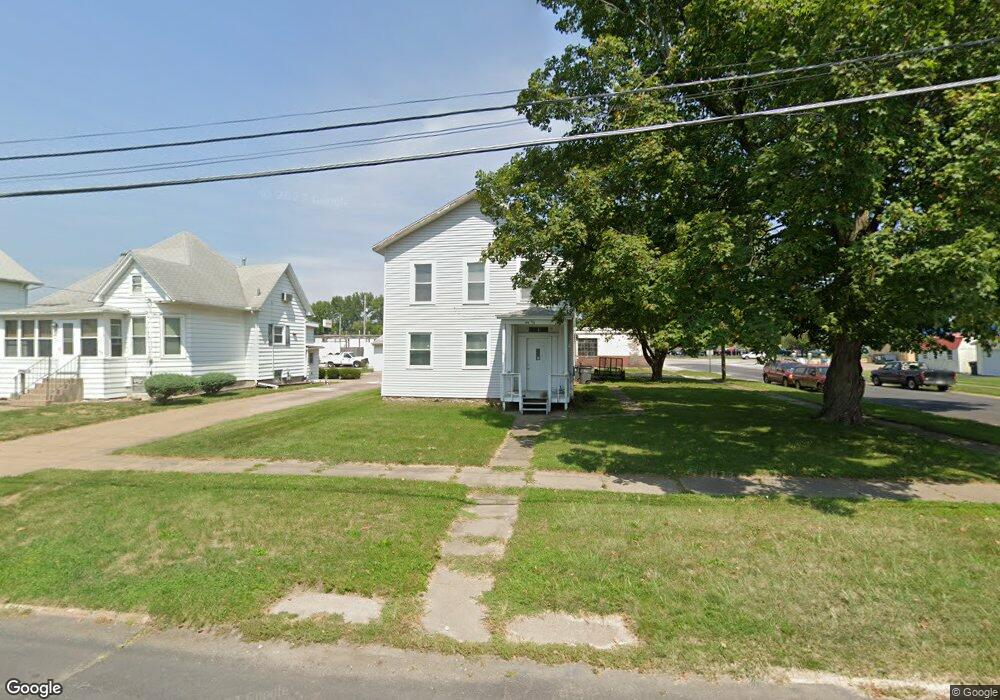
This home is located at 129 2nd Ave E, Milan, IL 61264 and is currently estimated at $178,969, approximately $54 per square foot. 129 2nd Ave E is a home located in Rock Island County with nearby schools including Thomas Jefferson Elementary School, Edison Jr High School, and Rock Island High School.
Ownership History
Date
Name
Owned For
Owner Type
Purchase Details
Closed on
Oct 7, 2025
Sold by
Moore Michael J
Bought by
Gulley Earl B
Current Estimated Value
Home Financials for this Owner
Home Financials are based on the most recent Mortgage that was taken out on this home.
Original Mortgage
$140,720
Outstanding Balance
$140,577
Interest Rate
5.88%
Mortgage Type
New Conventional
Estimated Equity
$38,392
Purchase Details
Closed on
Aug 27, 2021
Sold by
Moore Theresa A
Bought by
Moore Michael J
Purchase Details
Closed on
Nov 1, 1989
Create a Home Valuation Report for This Property
The Home Valuation Report is an in-depth analysis detailing your home's value as well as a comparison with similar homes in the area
Home Values in the Area
Average Home Value in this Area
Purchase History
| Date | Buyer | Sale Price | Title Company |
|---|---|---|---|
| Gulley Earl B | $175,900 | None Listed On Document | |
| Moore Michael J | -- | None Listed On Document | |
| -- | $12,000 | -- |
Source: Public Records
Mortgage History
| Date | Status | Borrower | Loan Amount |
|---|---|---|---|
| Open | Gulley Earl B | $140,720 |
Source: Public Records
Tax History
| Year | Tax Paid | Tax Assessment Tax Assessment Total Assessment is a certain percentage of the fair market value that is determined by local assessors to be the total taxable value of land and additions on the property. | Land | Improvement |
|---|---|---|---|---|
| 2024 | $3,299 | $35,792 | $7,265 | $28,527 |
| 2023 | $3,299 | $33,451 | $6,790 | $26,661 |
| 2022 | $2,968 | $30,859 | $6,264 | $24,595 |
| 2021 | $2,949 | $29,223 | $5,932 | $23,291 |
| 2020 | $2,889 | $28,483 | $5,782 | $22,701 |
| 2019 | $2,897 | $28,201 | $5,725 | $22,476 |
| 2018 | $2,817 | $27,866 | $5,657 | $22,209 |
| 2017 | $2,572 | $27,347 | $5,552 | $21,795 |
| 2016 | $2,511 | $27,211 | $5,524 | $21,687 |
| 2015 | $2,517 | $27,068 | $5,495 | $21,573 |
| 2014 | $566 | $26,486 | $5,377 | $21,109 |
| 2013 | $566 | $26,486 | $5,377 | $21,109 |
Source: Public Records
Map
Nearby Homes
- 330 1st Ave E
- 216 5th St E
- 444 6th St E
- 450 7th Street Ct E
- 602 3rd Ave W
- 214 8th St E
- 613 9th Ave W
- 7509 24th St
- 221 Hilltop Ct
- 0 U S Highway 67
- 705 13th St W
- 8012 10th St W
- 14 Blackhawk Hills Ct
- 1992 W 65th Ave
- 8119 10th St W
- 517 Bruce Ave
- 209 17th St E
- 8306 8th St W
- LOT 04 40th Ave
- 217 17th Ave W
Your Personal Tour Guide
Ask me questions while you tour the home.