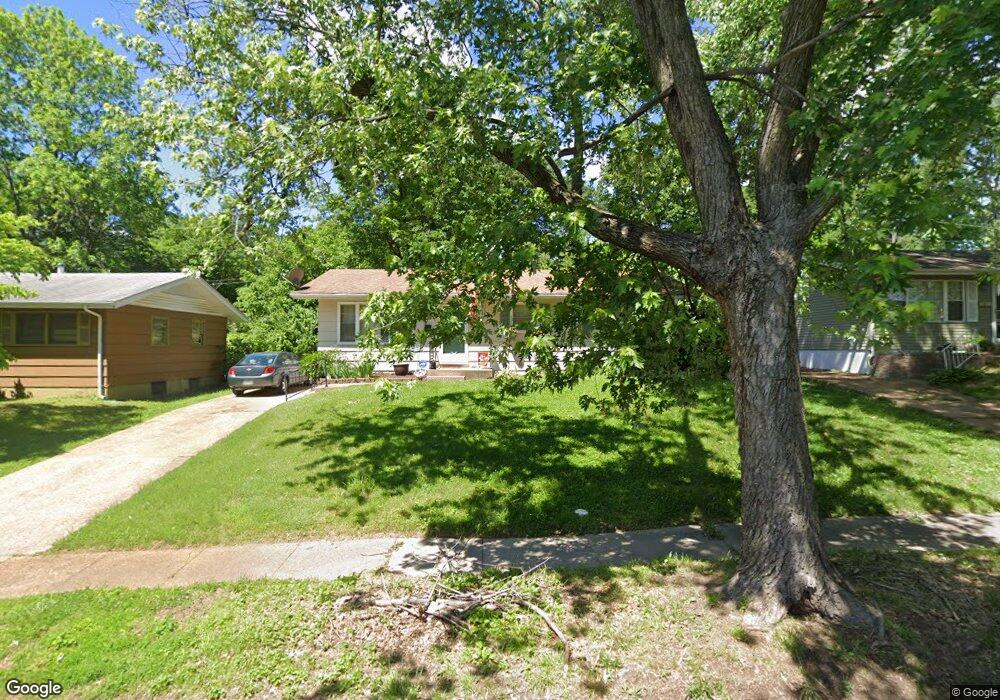
129 Bayview Dr Saint Louis, MO 63135
Estimated Value: $97,000 - $121,000
3
Beds
1
Bath
960
Sq Ft
$114/Sq Ft
Est. Value
About This Home
This home is located at 129 Bayview Dr, Saint Louis, MO 63135 and is currently estimated at $109,134, approximately $113 per square foot. 129 Bayview Dr is a home located in St. Louis County with nearby schools including Griffith Elementary School, Ferguson Middle School, and McCluer High School.
Ownership History
Date
Name
Owned For
Owner Type
Purchase Details
Closed on
Oct 18, 2024
Sold by
Cochran John and Cochran Linda
Bought by
Nielson Charlotte E
Current Estimated Value
Purchase Details
Closed on
Aug 13, 2024
Sold by
Cochran Bonnie B
Bought by
Cochran John P and Neilson Charlotte E
Purchase Details
Closed on
Jul 20, 1999
Sold by
Cochran Bonnie B
Bought by
Cochran John Patrick and Nelson Charlotte E
Create a Home Valuation Report for This Property
The Home Valuation Report is an in-depth analysis detailing your home's value as well as a comparison with similar homes in the area
Home Values in the Area
Average Home Value in this Area
Purchase History
| Date | Buyer | Sale Price | Title Company |
|---|---|---|---|
| Nielson Charlotte E | -- | Old Republic Title | |
| Cochran John P | -- | None Listed On Document | |
| Cochran John Patrick | -- | -- |
Source: Public Records
Tax History
| Year | Tax Paid | Tax Assessment Tax Assessment Total Assessment is a certain percentage of the fair market value that is determined by local assessors to be the total taxable value of land and additions on the property. | Land | Improvement |
|---|---|---|---|---|
| 2025 | $1,339 | $20,180 | $3,100 | $17,080 |
| 2024 | $1,339 | $18,390 | $2,770 | $15,620 |
| 2023 | $1,331 | $18,390 | $2,770 | $15,620 |
| 2022 | $1,005 | $12,020 | $3,550 | $8,470 |
| 2021 | $973 | $12,020 | $3,550 | $8,470 |
| 2020 | $983 | $10,920 | $2,010 | $8,910 |
| 2019 | $965 | $10,920 | $2,010 | $8,910 |
| 2018 | $1,027 | $10,390 | $2,430 | $7,960 |
| 2016 | $1,110 | $11,300 | $2,430 | $8,870 |
Source: Public Records
Map
Nearby Homes
- 912 Cheri Heights Ct
- 29 Fenwick Dr
- 914 Highmont Dr
- 128 Fenwick Dr
- 141 S Barat Ave
- 247 S Hartnett Ave Unit 12
- 277 Dashwood Dr
- 33 S Schlueter Ave
- 269 S Barat Ave
- 296 Meadowcrest Dr
- 324 Averill Ave
- 63 S Dellwood Ave
- 33 S Dellwood Ave
- 211 S Dellwood Dr
- 308 Superior Dr
- 325 Royce Dr
- 426 Darst Rd
- 212 Millman Dr
- 506 Averill Ave
- 4 S Dellwood Ave
Your Personal Tour Guide
Ask me questions while you tour the home.