129 Caleb St Portland, ME 04102
Rosemont NeighborhoodEstimated Value: $688,000 - $746,306
About This Home
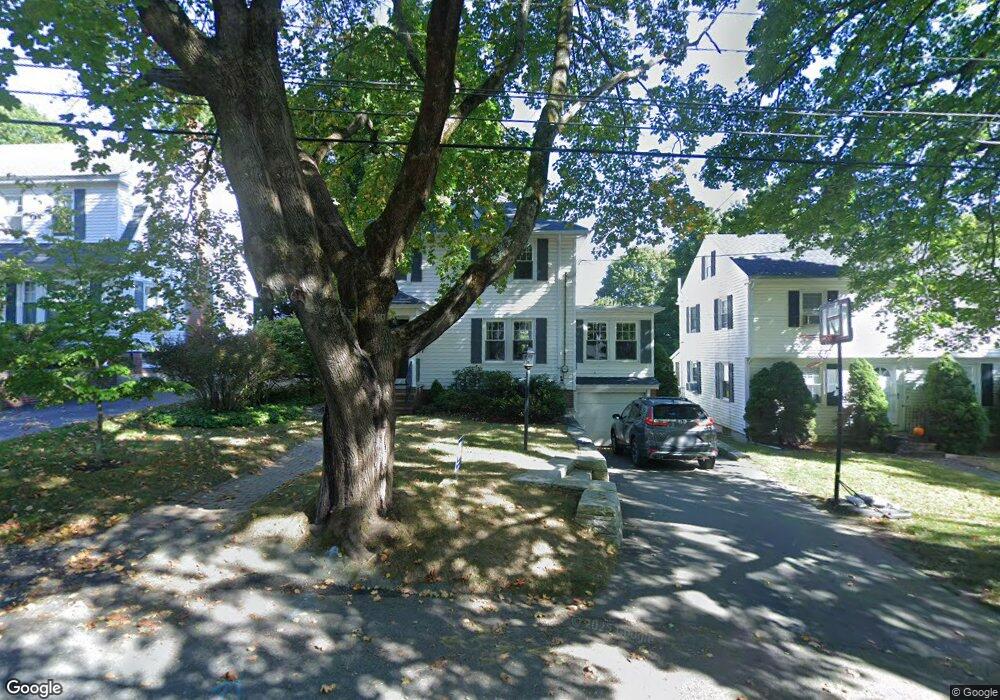
This home is located at 129 Caleb St, Portland, ME 04102 and is currently estimated at $723,077, approximately $406 per square foot. 129 Caleb St is a home located in Cumberland County with nearby schools including Ocean Avenue Elementary School, King Middle School, and Levey Day School.
Ownership History
We collect this data history from publicly available records. To have your information removed, we recommend requesting removal directly through your county’s website.
Purchase Details
Home Financials for this Owner
Home Financials are based on the most recent Mortgage that was taken out on this home.Home Values in the Area
Average Home Value in this Area
Purchase History
We collect this data history from publicly available records. To have your information removed, we recommend requesting removal directly through your county’s website.
| Date | Buyer | Sale Price | Title Company |
|---|---|---|---|
| -- | -- |
Mortgage History
We collect this data history from publicly available records. To have your information removed, we recommend requesting removal directly through your county’s website.
| Date | Status | Borrower | Loan Amount |
|---|---|---|---|
| Closed | $310,150 | ||
| Closed | $175,000 | ||
| Closed | $223,500 | ||
| Closed | $25,000 | ||
| Closed | $242,000 | ||
| Closed | $244,800 | ||
| Closed | $290,316 | ||
| Closed | $294,500 |
Tax History
We collect this data history from publicly available records. To have your information removed, we recommend requesting removal directly through your county’s website.
| Year | Tax Paid | Tax Assessment Tax Assessment Total Assessment is a certain percentage of the fair market value that is determined by local assessors to be the total taxable value of land and additions on the property. | Land | Improvement |
|---|---|---|---|---|
| 2025 | $8,872 | $740,600 | $144,100 | $596,500 |
| 2024 | $8,209 | $546,900 | $134,600 | $412,300 |
| 2023 | $7,881 | $546,900 | $134,600 | $412,300 |
| 2022 | $6,074 | $446,300 | $134,600 | $311,700 |
| 2021 | $5,797 | $446,300 | $134,600 | $311,700 |
| 2020 | $6,727 | $288,600 | $134,600 | $154,000 |
| 2019 | $6,727 | $288,600 | $134,600 | $154,000 |
| 2018 | $6,488 | $288,600 | $134,600 | $154,000 |
| 2017 | $6,038 | $278,900 | $134,600 | $144,300 |
| 2016 | $5,888 | $278,900 | $134,600 | $144,300 |
| 2015 | $5,754 | $278,900 | $134,600 | $144,300 |
| 2014 | $5,578 | $278,900 | $134,600 | $144,300 |
Map
- 160 Craigie St
- 76 Edwards St
- 15 Coachlight Ln
- 104 Bolton St
- 401 Brighton Ave Unit 7
- 245 Brighton Ave Unit 2
- 25 Deblois St
- 15 Rudman Rd
- 16 Stoneledge Dr
- 169 Longfellow St
- 142 Longfellow St
- 63 Capisic St Unit A
- 63 Capisic St Unit B
- 83 Capisic St
- 33 Prospect St
- 25 Benjamin Way
- 141 William St
- 325 Woodford St
- 119 Capisic St
- 271 Woodford St
Ask me questions while you tour the home.