129 Centre St Quincy, MA 02169
South Quincy NeighborhoodEstimated Value: $610,000 - $679,761
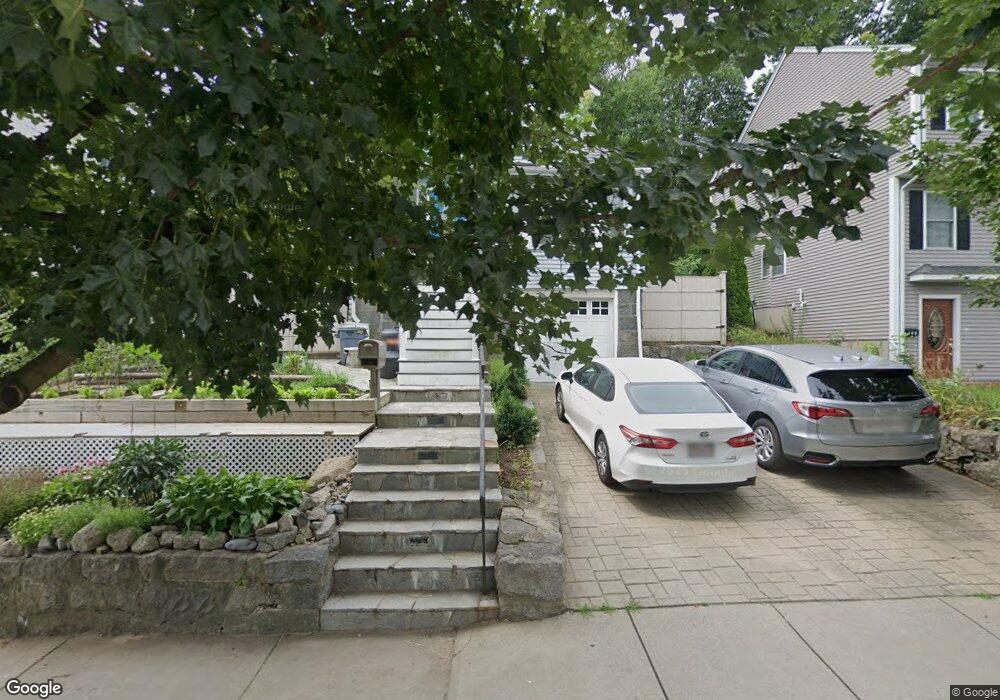
About This Home
This home is located at 129 Centre St, Quincy, MA 02169 and is currently estimated at $639,690, approximately $456 per square foot. 129 Centre St is a home located in Norfolk County with nearby schools including South West Middle School, Lincoln-Hancock Community School, and Quincy High School.
Ownership History
We collect this data history from publicly available records. To have your information removed, we recommend requesting removal directly through your county’s website.
Purchase Details
Home Financials for this Owner
Home Financials are based on the most recent Mortgage that was taken out on this home.Home Values in the Area
Average Home Value in this Area
Purchase History
We collect this data history from publicly available records. To have your information removed, we recommend requesting removal directly through your county’s website.
| Date | Buyer | Sale Price | Title Company |
|---|---|---|---|
| $327,000 | -- |
Mortgage History
We collect this data history from publicly available records. To have your information removed, we recommend requesting removal directly through your county’s website.
| Date | Status | Borrower | Loan Amount |
|---|---|---|---|
| Open | $227,000 |
Tax History
We collect this data history from publicly available records. To have your information removed, we recommend requesting removal directly through your county’s website.
| Year | Tax Paid | Tax Assessment Tax Assessment Total Assessment is a certain percentage of the fair market value that is determined by local assessors to be the total taxable value of land and additions on the property. | Land | Improvement |
|---|---|---|---|---|
| 2025 | $6,342 | $550,000 | $269,900 | $280,100 |
| 2024 | $5,935 | $526,600 | $257,000 | $269,600 |
| 2023 | $5,445 | $489,200 | $233,700 | $255,500 |
| 2022 | $5,357 | $447,200 | $194,700 | $252,500 |
| 2021 | $4,976 | $409,900 | $194,700 | $215,200 |
| 2020 | $4,901 | $394,300 | $194,700 | $199,600 |
| 2019 | $4,773 | $380,300 | $183,700 | $196,600 |
| 2018 | $4,634 | $347,400 | $170,100 | $177,300 |
| 2017 | $4,513 | $318,500 | $153,900 | $164,600 |
| 2016 | $4,075 | $283,800 | $133,800 | $150,000 |
| 2015 | $3,958 | $271,100 | $133,800 | $137,300 |
| 2014 | $3,810 | $256,400 | $133,800 | $122,600 |
Map
- 31 Station St
- 58 Village Dr
- 91 Garfield St
- 14 Fallon Ct Unit 14
- 46 Lyons St Unit 46
- 20 Miller St Unit 2
- 166 Suomi Rd
- 211 Copeland St
- 21 Totman St Unit 205
- 21 Totman St Unit 210
- 21 Totman St Unit 302
- 21 Totman St Unit 403
- 21 Totman St Unit 301
- 211 West St Unit 11B
- 211 West St Unit 4B
- 211 West St Unit 12B
- 117 Quincy St Unit 2
- 67-69 Penn St
- 308 Quarry St Unit 405
- 8 Jackson St Unit C1
- 127 Centre St
- 133 Centre St
- 133 Centre St Unit 2
- 133 Centre St Unit 1
- 137 Centre St
- 123 Centre St Unit 1
- 123 Centre St
- 123 Centre St Unit 2
- 125 Centre St Unit 2
- 125 Centre St Unit 1
- 125 Centre St Unit 125
- 125 Centre St
- 141 Centre St
- 145 Centre St
- 134 Centre St
- 124 Centre St
- 128 Centre St
- 117 Centre St
- 126 - 124 Centre St
- 138 Centre St
Ask me questions while you tour the home.