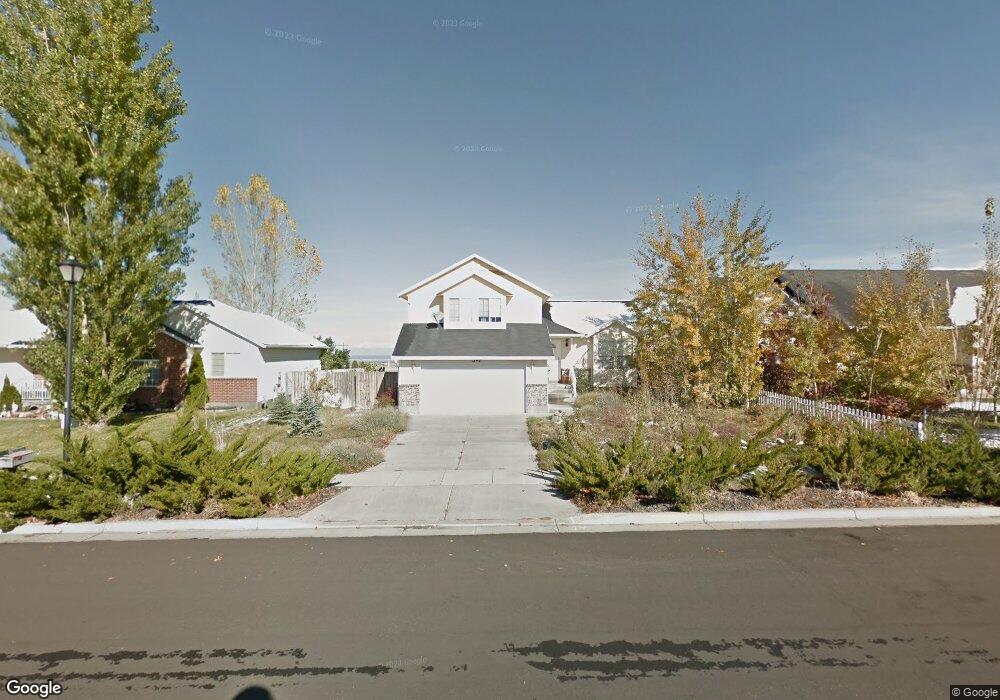
1293 E 970 N Tooele, UT 84074
Estimated Value: $421,000 - $537,000
3
Beds
3
Baths
2,043
Sq Ft
$224/Sq Ft
Est. Value
About This Home
This home is located at 1293 E 970 N, Tooele, UT 84074 and is currently estimated at $456,835, approximately $223 per square foot. 1293 E 970 N is a home located in Tooele County with nearby schools including Middle Canyon Elementary School, Tooele Junior High School, and Tooele High School.
Ownership History
Date
Name
Owned For
Owner Type
Purchase Details
Closed on
Jan 11, 2022
Sold by
Wendy Lessig Living Trust and The Wendy Lessig Living Trust
Bought by
Jackson Noah Samuel and Jackson Laura Beth
Current Estimated Value
Home Financials for this Owner
Home Financials are based on the most recent Mortgage that was taken out on this home.
Original Mortgage
$413,250
Outstanding Balance
$380,911
Interest Rate
3.12%
Mortgage Type
New Conventional
Estimated Equity
$75,924
Purchase Details
Closed on
Feb 22, 2018
Sold by
Lessig Wendy S and Wendy S Lessig Living Trust
Bought by
Lessig Wendy S and Wendy Lessig Living Trust
Create a Home Valuation Report for This Property
The Home Valuation Report is an in-depth analysis detailing your home's value as well as a comparison with similar homes in the area
Purchase History
| Date | Buyer | Sale Price | Title Company |
|---|---|---|---|
| Jackson Noah Samuel | -- | Tooele Title | |
| Lessig Wendy S | -- | None Available |
Source: Public Records
Mortgage History
| Date | Status | Borrower | Loan Amount |
|---|---|---|---|
| Open | Jackson Noah Samuel | $413,250 |
Source: Public Records
Tax History
| Year | Tax Paid | Tax Assessment Tax Assessment Total Assessment is a certain percentage of the fair market value that is determined by local assessors to be the total taxable value of land and additions on the property. | Land | Improvement |
|---|---|---|---|---|
| 2025 | $2,795 | $423,895 | $100,000 | $323,895 |
| 2024 | $2,961 | $225,983 | $55,000 | $170,983 |
| 2023 | $2,961 | $219,506 | $52,383 | $167,123 |
| 2022 | $2,514 | $216,334 | $51,906 | $164,428 |
| 2021 | $1,966 | $141,498 | $20,763 | $120,735 |
| 2020 | $1,887 | $235,514 | $37,750 | $197,764 |
| 2019 | $1,772 | $217,535 | $37,750 | $179,785 |
| 2018 | $1,652 | $192,360 | $40,000 | $152,360 |
| 2017 | $1,239 | $171,243 | $30,000 | $141,243 |
| 2016 | $1,024 | $84,051 | $16,500 | $67,551 |
| 2015 | $1,024 | $74,445 | $0 | $0 |
| 2014 | -- | $74,445 | $0 | $0 |
Source: Public Records
Map
Nearby Homes
- 932 N 1250 E
- 1224 E 970 N
- 1046 Cedarwood Rd
- 208 E 850 N Unit A
- 224 E 850 N St Unit A
- 224 E 850 N Unit D
- 208 E 850 N Unit C
- 238 E 850 St N Unit D
- 1266 E 850 N
- 993 White Pine Dr
- 802 E 1120 N
- 1194 N 690 E
- 647 E 980 N
- 677 Kings Landing
- 936 N 580 E
- 743 N 690 E
- 1148 N 550 E
- 618 E 670 N
- 792 E 540 N
- 518 E 740 N
Your Personal Tour Guide
Ask me questions while you tour the home.