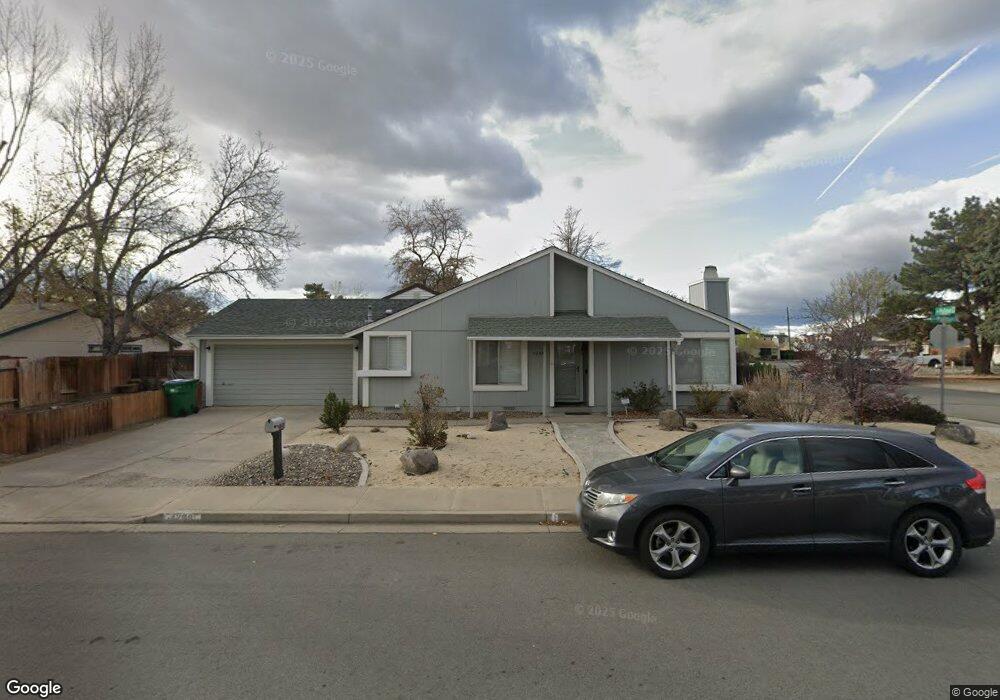
1299 Pullman Dr Sparks, NV 89434
O'Callaghan NeighborhoodEstimated Value: $324,000 - $425,000
About This Home
This home is located at 1299 Pullman Dr, Sparks, NV 89434 and is currently estimated at $386,760, approximately $310 per square foot. 1299 Pullman Dr is a home located in Washoe County with nearby schools including Katherine Dunn Elementary School, George L Dilworth Middle School, and Edward C Reed High School.
Ownership History
We collect this data history from publicly available records. To have your information removed, we recommend requesting removal directly through your county’s website.
Purchase Details
Purchase Details
Home Financials for this Owner
Home Financials are based on the most recent Mortgage that was taken out on this home.Purchase Details
Purchase Details
Home Financials for this Owner
Home Financials are based on the most recent Mortgage that was taken out on this home.Purchase Details
Home Financials for this Owner
Home Financials are based on the most recent Mortgage that was taken out on this home.Purchase Details
Purchase Details
Home Financials for this Owner
Home Financials are based on the most recent Mortgage that was taken out on this home.Purchase Details
Home Financials for this Owner
Home Financials are based on the most recent Mortgage that was taken out on this home.Purchase Details
Home Financials for this Owner
Home Financials are based on the most recent Mortgage that was taken out on this home.Purchase Details
Home Financials for this Owner
Home Financials are based on the most recent Mortgage that was taken out on this home.Purchase Details
Home Financials for this Owner
Home Financials are based on the most recent Mortgage that was taken out on this home.Home Values in the Area
Average Home Value in this Area
Purchase History
We collect this data history from publicly available records. To have your information removed, we recommend requesting removal directly through your county’s website.
| Date | Buyer | Sale Price | Title Company |
|---|---|---|---|
| -- | Stewart Title | ||
| $285,000 | Stewart Title | ||
| -- | Stewart Title | ||
| -- | None Available | ||
| $126,000 | First Centennial Reno | ||
| $272,500 | Western Title Incorporated | ||
| -- | -- | ||
| -- | Western Title Incorporated | ||
| $114,000 | Stewart Title | ||
| -- | First Centennial Title Co | ||
| -- | First Centennial Title Co | ||
| -- | First Centennial Title Co |
Mortgage History
We collect this data history from publicly available records. To have your information removed, we recommend requesting removal directly through your county’s website.
| Date | Status | Borrower | Loan Amount |
|---|---|---|---|
| Previous Owner | $264,000 | ||
| Previous Owner | $100,800 | ||
| Previous Owner | $217,600 | ||
| Previous Owner | $225,000 | ||
| Previous Owner | $77,000 | ||
| Previous Owner | $41,300 | ||
| Closed | $225,000 |
Tax History
We collect this data history from publicly available records. To have your information removed, we recommend requesting removal directly through your county’s website.
| Year | Tax Paid | Tax Assessment Tax Assessment Total Assessment is a certain percentage of the fair market value that is determined by local assessors to be the total taxable value of land and additions on the property. | Land | Improvement |
|---|---|---|---|---|
| 2026 | $1,093 | $52,429 | $30,380 | $22,049 |
| 2025 | $1,419 | $53,069 | $30,380 | $22,689 |
| 2024 | $1,387 | $50,077 | $25,725 | $24,352 |
| 2023 | $1,387 | $50,224 | $28,280 | $21,944 |
| 2022 | $1,340 | $44,367 | $25,060 | $19,307 |
| 2021 | $1,240 | $37,041 | $17,325 | $19,716 |
| 2020 | $1,165 | $37,352 | $17,150 | $20,202 |
| 2019 | $1,110 | $37,871 | $17,815 | $20,056 |
| 2018 | $1,062 | $32,023 | $12,110 | $19,913 |
| 2017 | $1,016 | $30,766 | $10,675 | $20,091 |
| 2016 | $991 | $29,856 | $9,240 | $20,616 |
| 2015 | $990 | $30,177 | $8,855 | $21,322 |
| 2014 | $959 | $27,583 | $6,825 | $20,758 |
| 2013 | -- | $25,629 | $5,040 | $20,589 |
Map
- 1279 Junction Dr
- 1777 Noreen Dr
- 1831 Fargo Way
- 736 Marracco Dr
- 726 Marracco Dr
- 675 Parlanti Ln Unit 18
- 675 Parlanti Ln Unit 131
- 675 Parlanti Ln Unit 33
- 675 Parlanti Ln Unit 11
- 675 Parlanti Ln Unit 109
- 675 Parlanti Ln Unit 63
- 675 Parlanti Ln Unit 50
- 1841 Burnside Dr
- 654 Marracco Dr
- 1236 Flora Glen Dr
- 991 Desert View Dr
- 849 Woodberry Dr Unit 4
- 2030 Woodhaven Ln
- 1987 Bonita Vista Dr
- 2205 Morninglory Dr
- 1305 Pullman Dr
- 1301 Pullman Dr
- 1309 Pullman Dr
- 1289 Pullman Ct
- 1291 Pullman Ct
- 1304 Pullman Dr
- 1313 Pullman Dr
- 1297 Pullman Ct
- 1308 Pullman Dr
- 1293 Pullman Ct
- 1296 Junction Dr
- 1287 Pullman Ct
- 1023 Union St
- 1023 Union St Unit Street
- 1293 Junction Dr
- 1317 Pullman Dr
- 1333 Coupler Ct
- 1288 Pullman Dr
- 1292 Junction Dr
- 1337 Coupler Ct
Ask me questions while you tour the home.