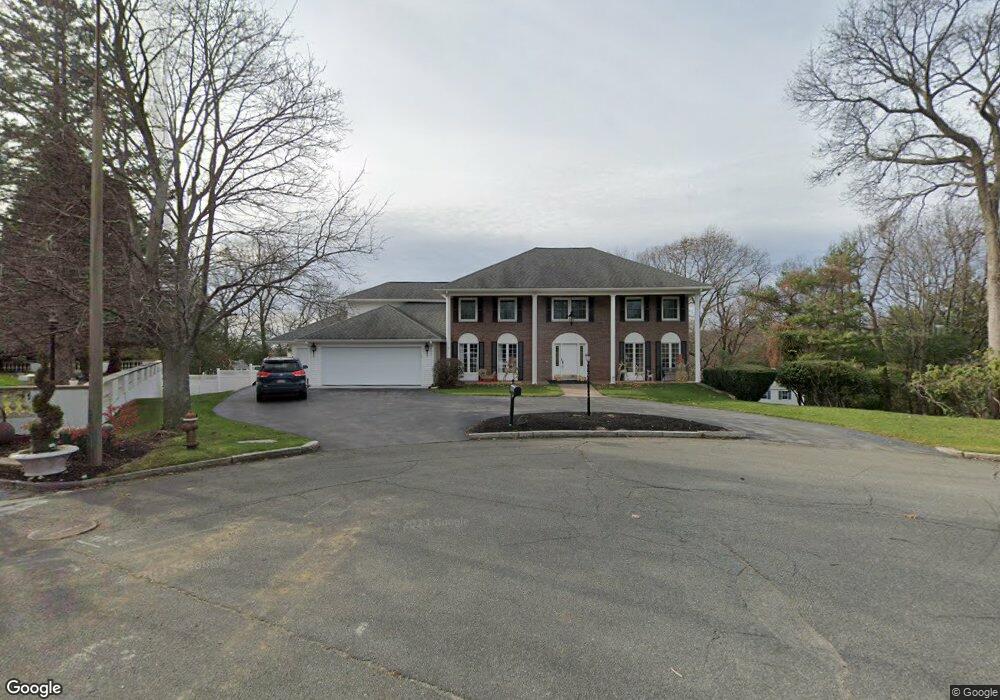
13 Azalea Rd Winchester, MA 01890
West Side NeighborhoodEstimated Value: $1,888,000 - $2,265,000
4
Beds
4
Baths
4,150
Sq Ft
$508/Sq Ft
Est. Value
About This Home
This home is located at 13 Azalea Rd, Winchester, MA 01890 and is currently estimated at $2,108,273, approximately $508 per square foot. 13 Azalea Rd is a home located in Middlesex County with nearby schools including Vinson-Owen Elementary School, McCall Middle School, and Winchester High School.
Ownership History
Date
Name
Owned For
Owner Type
Purchase Details
Closed on
Nov 10, 2014
Sold by
Rolli Andrea
Bought by
Andrea Rolli Ret
Current Estimated Value
Purchase Details
Closed on
Apr 28, 2011
Sold by
Rolli Andrea and Rolli William
Bought by
Rolli Andrea
Purchase Details
Closed on
Jul 30, 2003
Sold by
Rudin Emily J and Rudin Joel
Bought by
Rolli Andrea and Rolli William
Purchase Details
Closed on
Jun 14, 2001
Sold by
Perrone Rt
Bought by
Rundin Joel and Burnett-Rudin Emily
Create a Home Valuation Report for This Property
The Home Valuation Report is an in-depth analysis detailing your home's value as well as a comparison with similar homes in the area
Home Values in the Area
Average Home Value in this Area
Purchase History
| Date | Buyer | Sale Price | Title Company |
|---|---|---|---|
| Andrea Rolli Ret | -- | -- | |
| Rolli Andrea | -- | -- | |
| Rolli Andrea | $1,150,000 | -- | |
| Rundin Joel | $1,050,000 | -- |
Source: Public Records
Mortgage History
| Date | Status | Borrower | Loan Amount |
|---|---|---|---|
| Previous Owner | Rundin Joel | $275,000 | |
| Previous Owner | Rundin Joel | $500,000 |
Source: Public Records
Tax History
| Year | Tax Paid | Tax Assessment Tax Assessment Total Assessment is a certain percentage of the fair market value that is determined by local assessors to be the total taxable value of land and additions on the property. | Land | Improvement |
|---|---|---|---|---|
| 2025 | $223 | $2,007,600 | $1,041,400 | $966,200 |
| 2024 | $21,476 | $1,895,500 | $1,001,400 | $894,100 |
| 2023 | $20,583 | $1,744,300 | $881,400 | $862,900 |
| 2022 | $20,055 | $1,603,100 | $761,300 | $841,800 |
| 2021 | $19,106 | $1,489,200 | $661,300 | $827,900 |
| 2020 | $18,451 | $1,489,200 | $661,300 | $827,900 |
| 2019 | $18,034 | $1,489,200 | $661,300 | $827,900 |
| 2018 | $17,416 | $1,428,700 | $639,300 | $789,400 |
| 2017 | $16,409 | $1,336,200 | $579,300 | $756,900 |
| 2016 | $15,348 | $1,314,000 | $579,300 | $734,700 |
| 2015 | $14,986 | $1,234,400 | $526,300 | $708,100 |
| 2014 | $14,911 | $1,177,800 | $486,300 | $691,500 |
Source: Public Records
Map
Nearby Homes
Your Personal Tour Guide
Ask me questions while you tour the home.