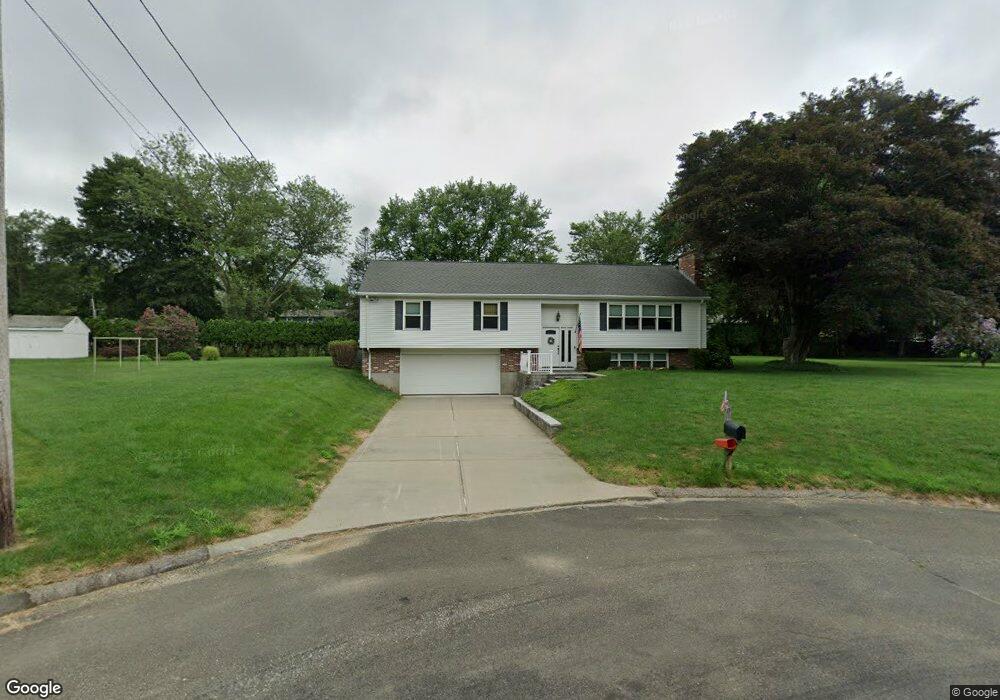
13 Debbie Ct Norwich, CT 06360
Yantic NeighborhoodEstimated Value: $369,000 - $429,000
3
Beds
2
Baths
1,444
Sq Ft
$272/Sq Ft
Est. Value
About This Home
This home is located at 13 Debbie Ct, Norwich, CT 06360 and is currently estimated at $392,429, approximately $271 per square foot. 13 Debbie Ct is a home located in New London County with nearby schools including Moriarty Magnet Elementary School, Kelly STEAM Magnet Middle School, and Stoneview Children's University.
Ownership History
Date
Name
Owned For
Owner Type
Purchase Details
Closed on
Jan 5, 1973
Bought by
Messier Andre J and Messier Sheila B
Current Estimated Value
Create a Home Valuation Report for This Property
The Home Valuation Report is an in-depth analysis detailing your home's value as well as a comparison with similar homes in the area
Home Values in the Area
Average Home Value in this Area
Purchase History
We collect this data history from publicly available records. To have your information removed, we recommend requesting removal directly through your county’s website.
| Date | Buyer | Sale Price | Title Company |
|---|---|---|---|
| Messier Andre J | -- | -- |
Source: Public Records
Mortgage History
We collect this data history from publicly available records. To have your information removed, we recommend requesting removal directly through your county’s website.
| Date | Status | Borrower | Loan Amount |
|---|---|---|---|
| Closed | Messier Andre J | $78,200 | |
| Open | Messier Andre J | $143,000 | |
| Closed | Messier Andre J | $100,000 |
Source: Public Records
Tax History
| Year | Tax Paid | Tax Assessment Tax Assessment Total Assessment is a certain percentage of the fair market value that is determined by local assessors to be the total taxable value of land and additions on the property. | Land | Improvement |
|---|---|---|---|---|
| 2025 | $6,572 | $188,800 | $51,500 | $137,300 |
| 2024 | $6,278 | $188,800 | $51,500 | $137,300 |
| 2023 | $5,415 | $129,400 | $43,900 | $85,500 |
| 2022 | $5,458 | $129,400 | $43,900 | $85,500 |
| 2021 | $5,480 | $129,400 | $43,900 | $85,500 |
| 2020 | $5,480 | $129,300 | $43,800 | $85,500 |
| 2019 | $5,255 | $129,300 | $43,800 | $85,500 |
| 2018 | $5,879 | $141,800 | $50,200 | $91,600 |
| 2017 | $5,767 | $141,800 | $50,200 | $91,600 |
| 2016 | $5,912 | $141,800 | $50,200 | $91,600 |
| 2015 | $5,869 | $141,800 | $50,200 | $91,600 |
| 2014 | $5,536 | $141,800 | $50,200 | $91,600 |
Source: Public Records
Map
Nearby Homes
- 28 Adams Dr
- 18 Caulkins Rd
- 380 Scotland Rd
- 235 Scotland Rd
- 18 Reservoir Rd
- 12 Tanglewood Dr
- 116 Case St
- 61 Flyers Dr
- 59 Flyers Dr
- 89 Canterbury Turnpike
- 321 Canterbury Turnpike
- 18 Forestview Dr
- 230 Vergason Ave
- 345 Harland Rd
- 47 Huntington Ave
- 100 Merchants Ave
- 164 Harland Rd
- 26 Farm View Dr
- 42 Ox Hill Rd
- 38 Farm View Dr
Your Personal Tour Guide
Ask me questions while you tour the home.