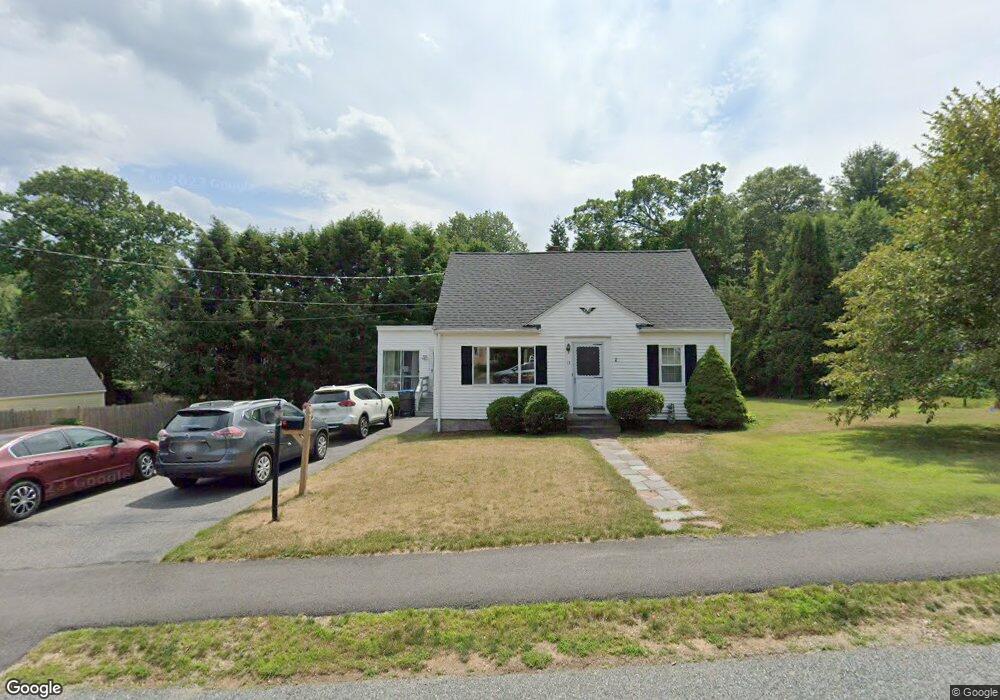
13 Ferndale Rd Unit 13 Natick, MA 01760
Estimated Value: $761,000 - $861,918
4
Beds
2
Baths
1,395
Sq Ft
$587/Sq Ft
Est. Value
About This Home
This home is located at 13 Ferndale Rd Unit 13, Natick, MA 01760 and is currently estimated at $818,480, approximately $586 per square foot. 13 Ferndale Rd Unit 13 is a home located in Middlesex County with nearby schools including Natick High School, Bennett-Hemenway (Ben-Hem) Elementary School, and Wilson Middle School.
Ownership History
Date
Name
Owned For
Owner Type
Purchase Details
Closed on
Jan 3, 2022
Sold by
Keady John F and Gallello Janet
Bought by
Uluski Brian A and Uluski Deborah A
Current Estimated Value
Home Financials for this Owner
Home Financials are based on the most recent Mortgage that was taken out on this home.
Original Mortgage
$612,750
Outstanding Balance
$558,914
Interest Rate
3.11%
Mortgage Type
Purchase Money Mortgage
Estimated Equity
$259,566
Create a Home Valuation Report for This Property
The Home Valuation Report is an in-depth analysis detailing your home's value as well as a comparison with similar homes in the area
Home Values in the Area
Average Home Value in this Area
Purchase History
| Date | Buyer | Sale Price | Title Company |
|---|---|---|---|
| Uluski Brian A | $635,000 | None Available |
Source: Public Records
Mortgage History
| Date | Status | Borrower | Loan Amount |
|---|---|---|---|
| Open | Uluski Brian A | $612,750 |
Source: Public Records
Tax History
| Year | Tax Paid | Tax Assessment Tax Assessment Total Assessment is a certain percentage of the fair market value that is determined by local assessors to be the total taxable value of land and additions on the property. | Land | Improvement |
|---|---|---|---|---|
| 2025 | $7,636 | $638,500 | $425,100 | $213,400 |
| 2024 | $7,403 | $603,800 | $400,100 | $203,700 |
| 2023 | $7,363 | $582,500 | $385,100 | $197,400 |
| 2022 | $7,157 | $536,500 | $350,000 | $186,500 |
| 2021 | $6,861 | $504,100 | $330,000 | $174,100 |
| 2020 | $6,657 | $489,100 | $315,000 | $174,100 |
| 2019 | $6,216 | $489,100 | $315,000 | $174,100 |
| 2018 | $5,802 | $444,600 | $300,000 | $144,600 |
| 2017 | $5,357 | $397,100 | $255,000 | $142,100 |
| 2016 | $4,971 | $366,300 | $234,000 | $132,300 |
| 2015 | $4,912 | $355,400 | $234,000 | $121,400 |
Source: Public Records
Map
Nearby Homes
- 14 Drury Ln
- 340 N Main St
- 8 Liberty St
- 5 Bradford Rd
- 4 Richard Rd
- 29 Irving Rd
- 1 Richard Rd
- 48 Wethersfield Rd
- 25 Irving Rd
- 50 Wethersfield Rd
- 278 N Main St
- 6 Cypress Rd
- 136 Commonwealth Rd
- 6 Ash St
- 45 W Plain St Unit 1
- 13 Shawmut Avenue Extension
- 186 Main St
- 201 Willow Brook Dr
- 8 Arlington Cir
- 37 Longfellow Rd
Your Personal Tour Guide
Ask me questions while you tour the home.