13 Flint St Marblehead, MA 01945
Estimated Value: $4,064,206 - $6,122,000
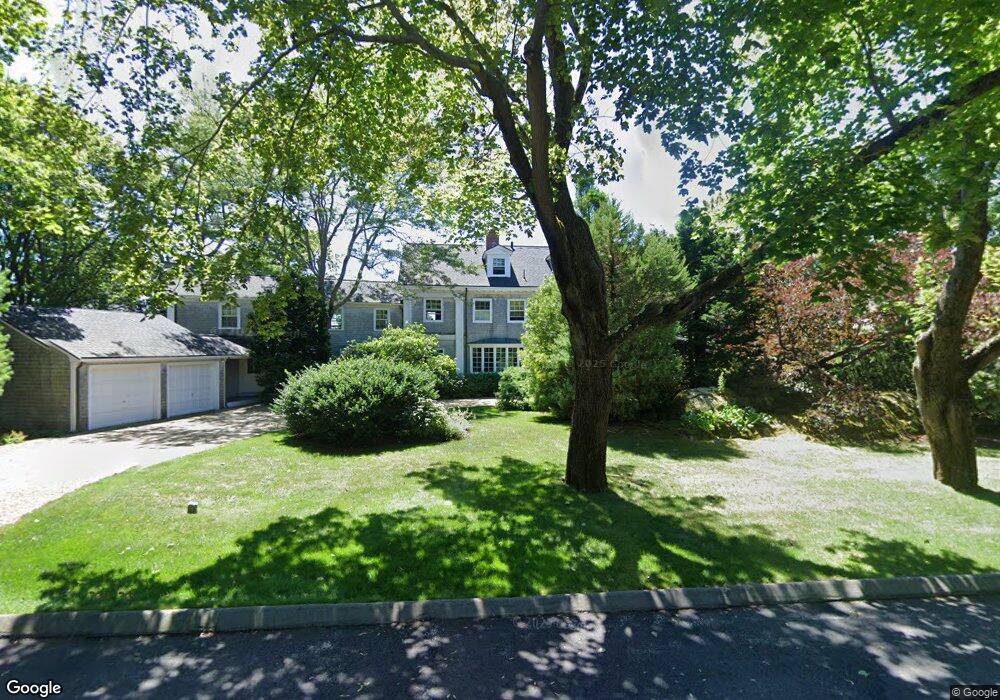
About This Home
This home is located at 13 Flint St, Marblehead, MA 01945 and is currently estimated at $5,116,069, approximately $750 per square foot. 13 Flint St is a home located in Essex County with nearby schools including Marblehead High School, Marblehead Community Charter Public School, and Devereux School.
Ownership History
We collect this data history from publicly available records. To have your information removed, we recommend requesting removal directly through your county’s website.
Purchase Details
Purchase Details
Home Values in the Area
Average Home Value in this Area
Purchase History
We collect this data history from publicly available records. To have your information removed, we recommend requesting removal directly through your county’s website.
| Date | Buyer | Sale Price | Title Company |
|---|---|---|---|
| -- | None Available | ||
| $1,025,888 | -- |
Mortgage History
We collect this data history from publicly available records. To have your information removed, we recommend requesting removal directly through your county’s website.
| Date | Status | Borrower | Loan Amount |
|---|---|---|---|
| Previous Owner | $561,000 | ||
| Previous Owner | $675,000 | ||
| Previous Owner | $600,000 | ||
| Previous Owner | $50,000 |
Tax History
We collect this data history from publicly available records. To have your information removed, we recommend requesting removal directly through your county’s website.
| Year | Tax Paid | Tax Assessment Tax Assessment Total Assessment is a certain percentage of the fair market value that is determined by local assessors to be the total taxable value of land and additions on the property. | Land | Improvement |
|---|---|---|---|---|
| 2025 | $35,037 | $3,871,500 | $1,878,700 | $1,992,800 |
| 2024 | $37,462 | $4,181,000 | $2,384,700 | $1,796,300 |
| 2023 | $34,124 | $3,412,400 | $1,702,700 | $1,709,700 |
| 2022 | $35,248 | $3,350,600 | $1,592,700 | $1,757,900 |
| 2021 | $34,455 | $3,306,600 | $1,548,700 | $1,757,900 |
| 2020 | $33,817 | $3,254,800 | $1,658,700 | $1,596,100 |
| 2019 | $32,594 | $3,034,800 | $1,438,700 | $1,596,100 |
| 2018 | $31,746 | $2,880,800 | $1,284,700 | $1,596,100 |
| 2017 | $31,233 | $2,836,800 | $1,240,700 | $1,596,100 |
| 2016 | $30,512 | $2,748,800 | $1,152,700 | $1,596,100 |
| 2015 | $30,457 | $2,748,800 | $1,152,700 | $1,596,100 |
| 2014 | $29,782 | $2,685,500 | $1,108,700 | $1,576,800 |
Map
- 244 Ocean Ave
- 48 Harbor Ave
- 4 Ballast Ln
- 349 Ocean Ave
- 60 Brackett Place Unit D
- 55 Gregory St
- 372 Ocean Ave
- 1 Red Frank Ln
- 27 Waldron St
- 21 Hawkes St Unit 5
- 2 Commercial St Unit 3
- 40 Prospect St Unit 3
- 95 Front St Unit 1
- 9 Darling St
- 11 Leslie Cove
- 290 Washington St Unit B
- 126 Pleasant St
- 28 Orchard St
- 64 Pleasant St Unit A
- 44 Pleasant St Unit 1
Ask me questions while you tour the home.