Estimated Value: $823,000 - $1,216,000
3
Beds
3
Baths
1,990
Sq Ft
$477/Sq Ft
Est. Value
About This Home
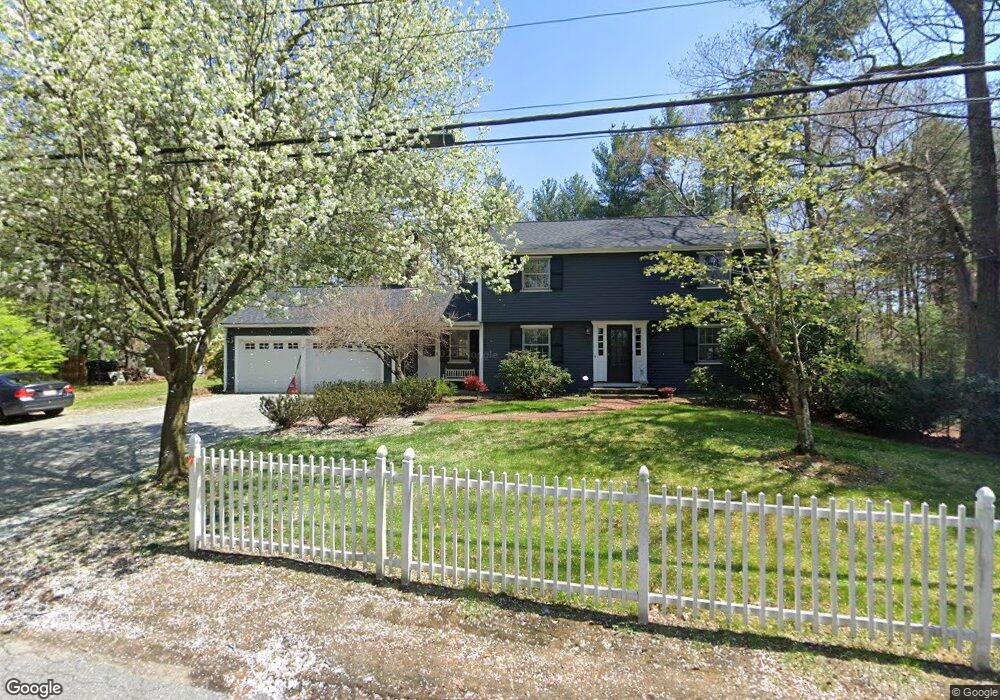
This home is located at 13 Forest Rd, Acton, MA 01720 and is currently estimated at $948,655, approximately $476 per square foot. 13 Forest Rd is a home located in Middlesex County with nearby schools including Acton-Boxborough Regional High School and Nashoba Brooks School.
Ownership History
Date
Name
Owned For
Owner Type
Purchase Details
Closed on
May 30, 1997
Sold by
Papatsoris Anastasios and Steven-Papatsoris Lori
Bought by
Lack Steven L and Lack Ann E
Current Estimated Value
Purchase Details
Closed on
May 28, 1993
Sold by
Gallagher James E
Bought by
Papatsoris Anastasios and Papatsoris Stevens-Papatsoris L
Create a Home Valuation Report for This Property
The Home Valuation Report is an in-depth analysis detailing your home's value as well as a comparison with similar homes in the area
Home Values in the Area
Average Home Value in this Area
Purchase History
| Date | Buyer | Sale Price | Title Company |
|---|---|---|---|
| Lack Steven L | $276,000 | -- | |
| Papatsoris Anastasios | $216,000 | -- |
Source: Public Records
Mortgage History
| Date | Status | Borrower | Loan Amount |
|---|---|---|---|
| Open | Papatsoris Anastasios | $362,692 | |
| Closed | Papatsoris Anastasios | $240,000 |
Source: Public Records
Tax History
| Year | Tax Paid | Tax Assessment Tax Assessment Total Assessment is a certain percentage of the fair market value that is determined by local assessors to be the total taxable value of land and additions on the property. | Land | Improvement |
|---|---|---|---|---|
| 2025 | $12,538 | $731,100 | $314,800 | $416,300 |
| 2024 | $11,749 | $704,800 | $314,800 | $390,000 |
| 2023 | $11,444 | $651,700 | $286,100 | $365,600 |
| 2022 | $11,022 | $566,700 | $248,900 | $317,800 |
| 2021 | $10,750 | $531,400 | $230,300 | $301,100 |
| 2020 | $9,732 | $505,800 | $230,300 | $275,500 |
| 2019 | $9,270 | $478,600 | $230,300 | $248,300 |
| 2018 | $9,124 | $470,800 | $230,300 | $240,500 |
| 2017 | $8,899 | $466,900 | $230,300 | $236,600 |
| 2016 | $8,890 | $462,300 | $230,300 | $232,000 |
| 2015 | $8,731 | $458,300 | $230,300 | $228,000 |
| 2014 | $8,486 | $436,300 | $230,300 | $206,000 |
Source: Public Records
Map
Nearby Homes
Your Personal Tour Guide
Ask me questions while you tour the home.