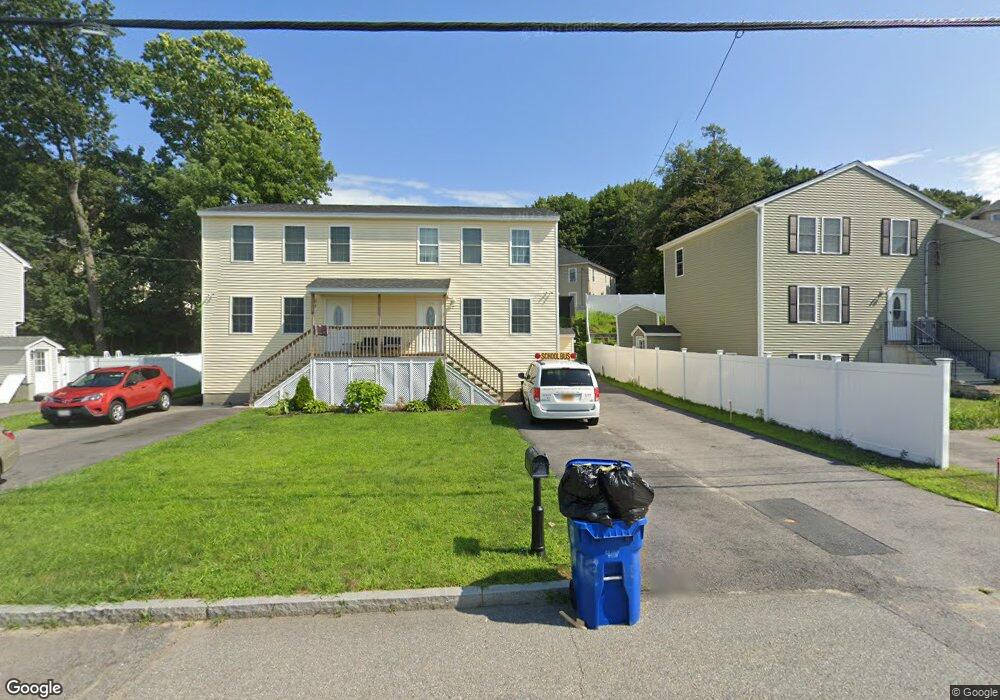
13 Glenn St Lawrence, MA 01843
Mount Vernon NeighborhoodEstimated Value: $723,000 - $801,000
6
Beds
2
Baths
2,050
Sq Ft
$368/Sq Ft
Est. Value
About This Home
This home is located at 13 Glenn St, Lawrence, MA 01843 and is currently estimated at $754,138, approximately $367 per square foot. 13 Glenn St is a home with nearby schools including John Breen School, School For Exceptional Studies, and Robert Frost Middle School.
Ownership History
Date
Name
Owned For
Owner Type
Purchase Details
Closed on
Mar 14, 2018
Sold by
Rjs Development Llc
Bought by
Chang Joyce
Current Estimated Value
Home Financials for this Owner
Home Financials are based on the most recent Mortgage that was taken out on this home.
Original Mortgage
$393,772
Outstanding Balance
$330,850
Interest Rate
4.22%
Mortgage Type
FHA
Estimated Equity
$423,288
Create a Home Valuation Report for This Property
The Home Valuation Report is an in-depth analysis detailing your home's value as well as a comparison with similar homes in the area
Home Values in the Area
Average Home Value in this Area
Purchase History
We collect this data history from publicly available records. To have your information removed, we recommend requesting removal directly through your county’s website.
| Date | Buyer | Sale Price | Title Company |
|---|---|---|---|
| Chang Joyce | $430,000 | -- | |
| Chang Joyce | $430,000 | -- |
Source: Public Records
Mortgage History
We collect this data history from publicly available records. To have your information removed, we recommend requesting removal directly through your county’s website.
| Date | Status | Borrower | Loan Amount |
|---|---|---|---|
| Open | Chang Joyce | $393,772 | |
| Closed | Chang Joyce | $393,772 |
Source: Public Records
Tax History
| Year | Tax Paid | Tax Assessment Tax Assessment Total Assessment is a certain percentage of the fair market value that is determined by local assessors to be the total taxable value of land and additions on the property. | Land | Improvement |
|---|---|---|---|---|
| 2025 | $6,066 | $689,300 | $171,100 | $518,200 |
| 2024 | $6,453 | $697,600 | $144,400 | $553,200 |
| 2023 | $6,322 | $622,200 | $128,800 | $493,400 |
| 2022 | $5,917 | $517,200 | $119,600 | $397,600 |
| 2021 | $5,814 | $473,800 | $116,900 | $356,900 |
| 2020 | $5,142 | $413,700 | $101,200 | $312,500 |
| 2019 | $2,194 | $160,400 | $100,800 | $59,600 |
| 2018 | $2,151 | $150,200 | $96,400 | $53,800 |
| 2017 | $233 | $15,200 | $15,200 | $0 |
| 2016 | $292 | $18,800 | $18,800 | $0 |
| 2015 | $284 | $18,800 | $18,800 | $0 |
Source: Public Records
Map
Nearby Homes
- 90 Beacon St Unit 12
- 2 Andover Terrace
- 110-112 Everett St
- 7 Westwood Terrace
- 11 Swan Ln Unit 11
- 8 Brookfield St
- 2 Dove Ln Unit 2
- 14 Tyler St Unit 1
- 100 Hancock St
- 17 Gorham St
- 0 Hudson Ave
- 2 Weeping Willow Dr
- 401 S Broadway
- 21 Clubview Dr Unit 21
- 132-134 S Broadway
- 117 Pearl St
- 5 Lafayette Ave
- 86 S Broadway
- 82 S Broadway
- 33 Garfield St
- 32 W Beacon St Unit 34
- 28 Bourque St Unit 30
- 30 W Beacon St
- 28 W Beacon St
- 28 W Beacon St Unit 28
- 24 Bourque St Unit 26
- 24-26 Bourque St
- 57 Glenn St
- 20 Bourque St
- 24 W Beacon St
- 26 W Beacon St
- 29 Bourque St Unit 2
- 27 Bourque St Unit 29
- 18 Bourque St Unit 18A
- 9 Glenn St
- 23-25 Bourque St
- 31 Bourque St Unit 33
- 21 Bourque St
- 19 Bourque St
- 16 Bourque St
Your Personal Tour Guide
Ask me questions while you tour the home.