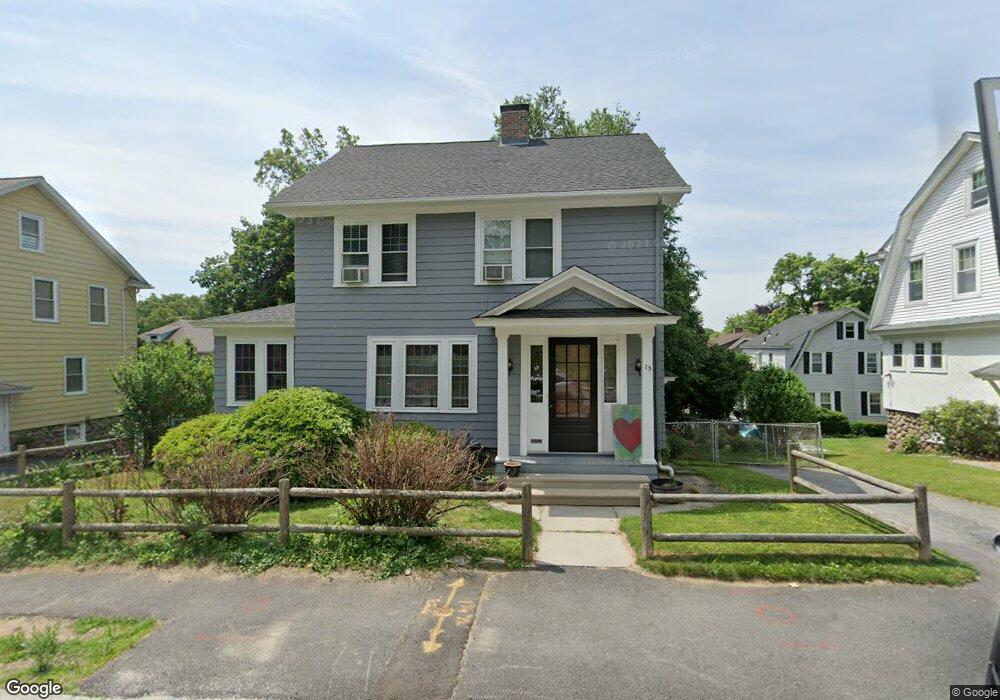
13 Hanna Rd Worcester, MA 01602
Newton Square NeighborhoodEstimated Value: $436,000 - $519,000
4
Beds
2
Baths
1,608
Sq Ft
$287/Sq Ft
Est. Value
About This Home
This home is located at 13 Hanna Rd, Worcester, MA 01602 and is currently estimated at $462,056, approximately $287 per square foot. 13 Hanna Rd is a home located in Worcester County with nearby schools including Chandler Magnet, Jacob Hiatt Magnet School, and Flagg Street School.
Ownership History
Date
Name
Owned For
Owner Type
Purchase Details
Closed on
Dec 29, 2000
Sold by
Olive Franklin T and Olive Barbara B
Bought by
Eisenberg Jonathan M and Faneuff Denise M
Current Estimated Value
Home Financials for this Owner
Home Financials are based on the most recent Mortgage that was taken out on this home.
Original Mortgage
$145,600
Interest Rate
7.7%
Mortgage Type
Purchase Money Mortgage
Purchase Details
Closed on
Mar 27, 1987
Sold by
Colman Sydney R
Bought by
Olive Franklin T
Create a Home Valuation Report for This Property
The Home Valuation Report is an in-depth analysis detailing your home's value as well as a comparison with similar homes in the area
Home Values in the Area
Average Home Value in this Area
Purchase History
| Date | Buyer | Sale Price | Title Company |
|---|---|---|---|
| Eisenberg Jonathan M | $182,000 | -- | |
| Olive Franklin T | $132,500 | -- |
Source: Public Records
Mortgage History
| Date | Status | Borrower | Loan Amount |
|---|---|---|---|
| Open | Olive Franklin T | $143,500 | |
| Closed | Olive Franklin T | $145,600 | |
| Previous Owner | Olive Franklin T | $123,300 | |
| Previous Owner | Olive Franklin T | $30,000 |
Source: Public Records
Tax History
| Year | Tax Paid | Tax Assessment Tax Assessment Total Assessment is a certain percentage of the fair market value that is determined by local assessors to be the total taxable value of land and additions on the property. | Land | Improvement |
|---|---|---|---|---|
| 2025 | $4,995 | $378,700 | $104,900 | $273,800 |
| 2024 | $4,891 | $355,700 | $104,900 | $250,800 |
| 2023 | $4,698 | $327,600 | $91,200 | $236,400 |
| 2022 | $4,335 | $285,000 | $73,000 | $212,000 |
| 2021 | $4,199 | $257,900 | $58,400 | $199,500 |
| 2020 | $4,066 | $239,200 | $58,400 | $180,800 |
| 2019 | $3,906 | $217,000 | $52,500 | $164,500 |
| 2018 | $3,880 | $205,200 | $52,500 | $152,700 |
| 2017 | $3,731 | $194,100 | $52,500 | $141,600 |
| 2016 | $3,726 | $180,800 | $39,600 | $141,200 |
| 2015 | $3,629 | $180,800 | $39,600 | $141,200 |
| 2014 | $3,533 | $180,800 | $39,600 | $141,200 |
Source: Public Records
Map
Nearby Homes
- 6 Moore Ave
- 1 Ashmore Rd
- 31 Lenox St
- 860 Pleasant St
- 51 Brantwood Rd
- 10 Wrentham Rd Unit 308
- 10 Wrentham Rd Unit 212
- 41 Dellwood Rd
- 2 Saxon Rd
- 26 Westbrook Rd
- 15 Chesterfield Rd
- 35 Chesterfield Rd
- 118 Beaconsfield Rd
- 23 Orrison St
- 542 Chandler St
- 42 Ellis Dr
- 618 Mill St
- 18 Hadwen Ln
- 23 Tiverton Pkwy
- 35 Hadwen Ln
Your Personal Tour Guide
Ask me questions while you tour the home.