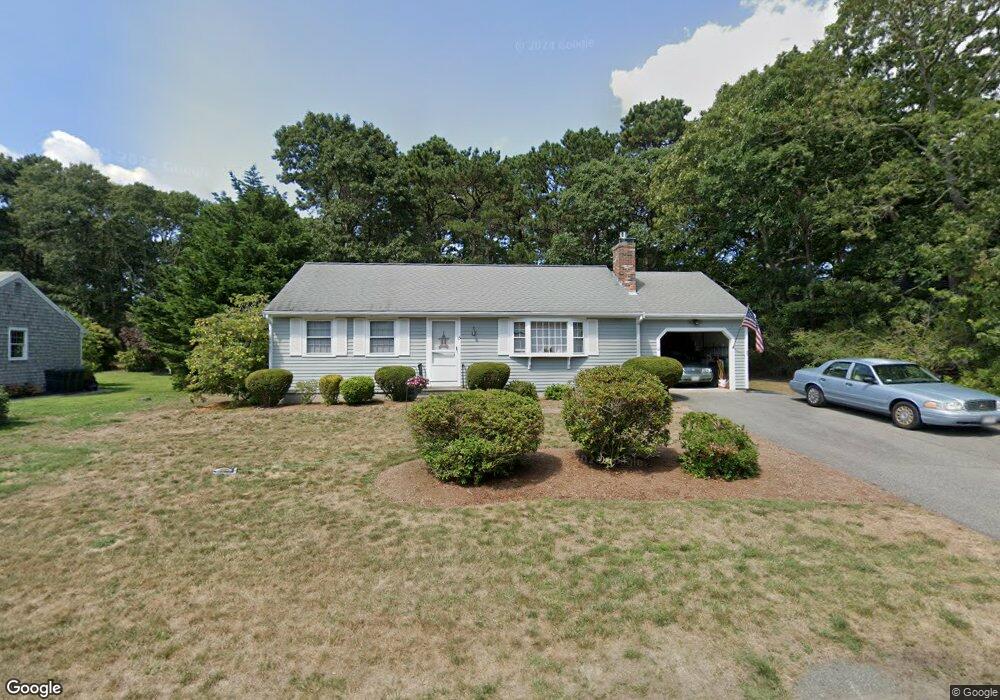
13 Julia Ct Harwich, MA 02645
Northwest Harwich NeighborhoodEstimated Value: $549,000 - $583,000
2
Beds
1
Bath
1,001
Sq Ft
$560/Sq Ft
Est. Value
About This Home
This home is located at 13 Julia Ct, Harwich, MA 02645 and is currently estimated at $560,300, approximately $559 per square foot. 13 Julia Ct is a home located in Barnstable County with nearby schools including Harwich Elementary School, Chatham Elementary School, and Monomoy Regional Middle School.
Ownership History
Date
Name
Owned For
Owner Type
Purchase Details
Closed on
Mar 1, 1999
Sold by
Neal Regina
Bought by
Uhlman Joseph G and Uhlman Claire E
Current Estimated Value
Home Financials for this Owner
Home Financials are based on the most recent Mortgage that was taken out on this home.
Original Mortgage
$108,800
Interest Rate
6.78%
Mortgage Type
Purchase Money Mortgage
Create a Home Valuation Report for This Property
The Home Valuation Report is an in-depth analysis detailing your home's value as well as a comparison with similar homes in the area
Home Values in the Area
Average Home Value in this Area
Purchase History
| Date | Buyer | Sale Price | Title Company |
|---|---|---|---|
| Uhlman Joseph G | $136,000 | -- |
Source: Public Records
Mortgage History
| Date | Status | Borrower | Loan Amount |
|---|---|---|---|
| Open | Uhlman Joseph G | $107,600 | |
| Closed | Uhlman Joseph G | $107,600 | |
| Closed | Uhlman Joseph G | $108,800 |
Source: Public Records
Tax History
| Year | Tax Paid | Tax Assessment Tax Assessment Total Assessment is a certain percentage of the fair market value that is determined by local assessors to be the total taxable value of land and additions on the property. | Land | Improvement |
|---|---|---|---|---|
| 2025 | $3,167 | $535,800 | $210,600 | $325,200 |
| 2024 | $3,069 | $508,900 | $198,700 | $310,200 |
| 2023 | $2,947 | $443,800 | $180,600 | $263,200 |
| 2022 | $2,916 | $359,500 | $157,100 | $202,400 |
| 2021 | $2,724 | $316,700 | $142,800 | $173,900 |
| 2020 | $2,713 | $310,800 | $139,800 | $171,000 |
| 2019 | $2,543 | $293,300 | $134,300 | $159,000 |
| 2018 | $2,558 | $282,200 | $122,100 | $160,100 |
| 2017 | $2,356 | $262,700 | $111,300 | $151,400 |
| 2016 | $2,307 | $254,300 | $111,300 | $143,000 |
| 2015 | $2,225 | $248,000 | $109,100 | $138,900 |
| 2014 | $2,041 | $232,700 | $96,200 | $136,500 |
Source: Public Records
Map
Nearby Homes
Your Personal Tour Guide
Ask me questions while you tour the home.