13 Langdon St Worcester, MA 01608
Green Island NeighborhoodEstimated Value: $225,000 - $336,891
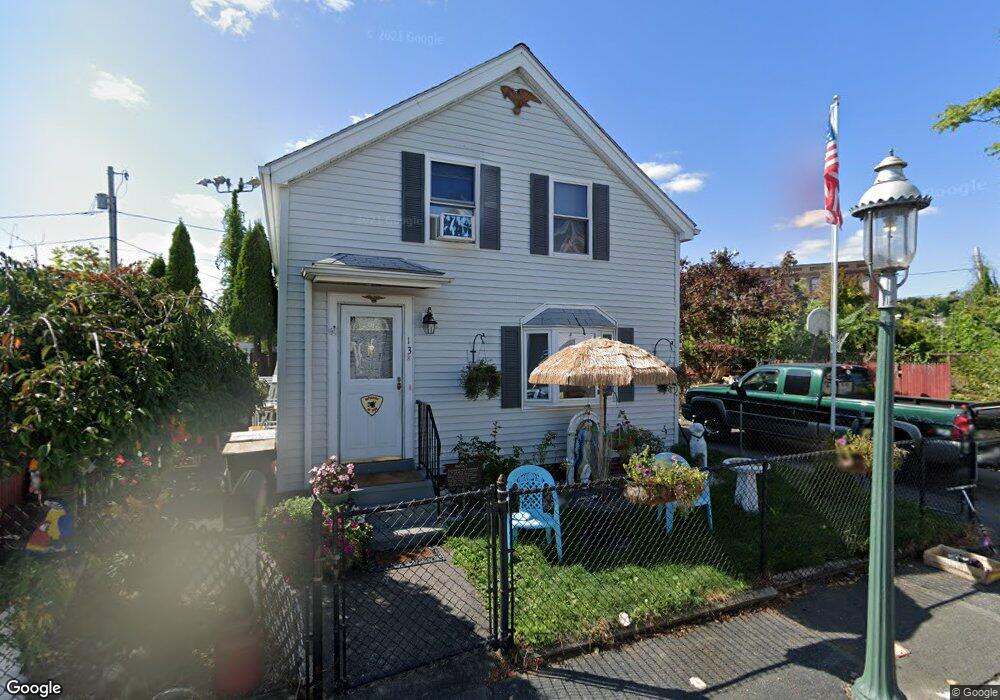
About This Home
This home is located at 13 Langdon St, Worcester, MA 01608 and is currently estimated at $305,973, approximately $339 per square foot. 13 Langdon St is a home located in Worcester County with nearby schools including Jacob Hiatt Magnet School, Chandler Elementary Community School, and Chandler Magnet.
Ownership History
We collect this data history from publicly available records. To have your information removed, we recommend requesting removal directly through your county’s website.
Purchase Details
Purchase Details
Purchase Details
Home Financials for this Owner
Home Financials are based on the most recent Mortgage that was taken out on this home.Home Values in the Area
Average Home Value in this Area
Purchase History
We collect this data history from publicly available records. To have your information removed, we recommend requesting removal directly through your county’s website.
| Date | Buyer | Sale Price | Title Company |
|---|---|---|---|
| -- | -- | ||
| -- | None Available | ||
| -- | None Available | ||
| $10,300 | -- | ||
| $10,300 | -- |
Mortgage History
We collect this data history from publicly available records. To have your information removed, we recommend requesting removal directly through your county’s website.
| Date | Status | Borrower | Loan Amount |
|---|---|---|---|
| Previous Owner | $40,850 | ||
| Previous Owner | $46,900 |
Tax History
We collect this data history from publicly available records. To have your information removed, we recommend requesting removal directly through your county’s website.
| Year | Tax Paid | Tax Assessment Tax Assessment Total Assessment is a certain percentage of the fair market value that is determined by local assessors to be the total taxable value of land and additions on the property. | Land | Improvement |
|---|---|---|---|---|
| 2025 | $3,251 | $246,500 | $57,500 | $189,000 |
| 2024 | $3,090 | $224,700 | $57,500 | $167,200 |
| 2023 | $2,933 | $204,500 | $46,200 | $158,300 |
| 2022 | $2,729 | $179,400 | $36,900 | $142,500 |
| 2021 | $2,584 | $158,700 | $29,600 | $129,100 |
| 2020 | $2,443 | $143,700 | $29,600 | $114,100 |
| 2019 | $2,399 | $133,300 | $29,300 | $104,000 |
| 2018 | $2,386 | $126,200 | $29,300 | $96,900 |
| 2017 | $2,230 | $116,000 | $29,300 | $86,700 |
| 2016 | $2,300 | $111,600 | $24,100 | $87,500 |
| 2015 | $2,240 | $111,600 | $24,100 | $87,500 |
| 2014 | $2,181 | $111,600 | $24,100 | $87,500 |
Map
- 17 Bigelow St
- 295 Southbridge St
- 10 Ellsworth St
- 13 Sigel St
- 10 Lagrange St
- 246 Millbury St
- 25 Canton St
- 19 Kelley Square
- 12 Oread St
- 67 Richland St
- 81 Ward St
- 70 Southbridge St Unit 811
- 70 Southbridge St Unit 313
- 70 Southbridge St Unit 310
- 55 Seymour St
- 6 Piedmont St
- 64 Green St
- 71 Fox St
- 4 Preston St
- 26 Sterling St
Ask me questions while you tour the home.