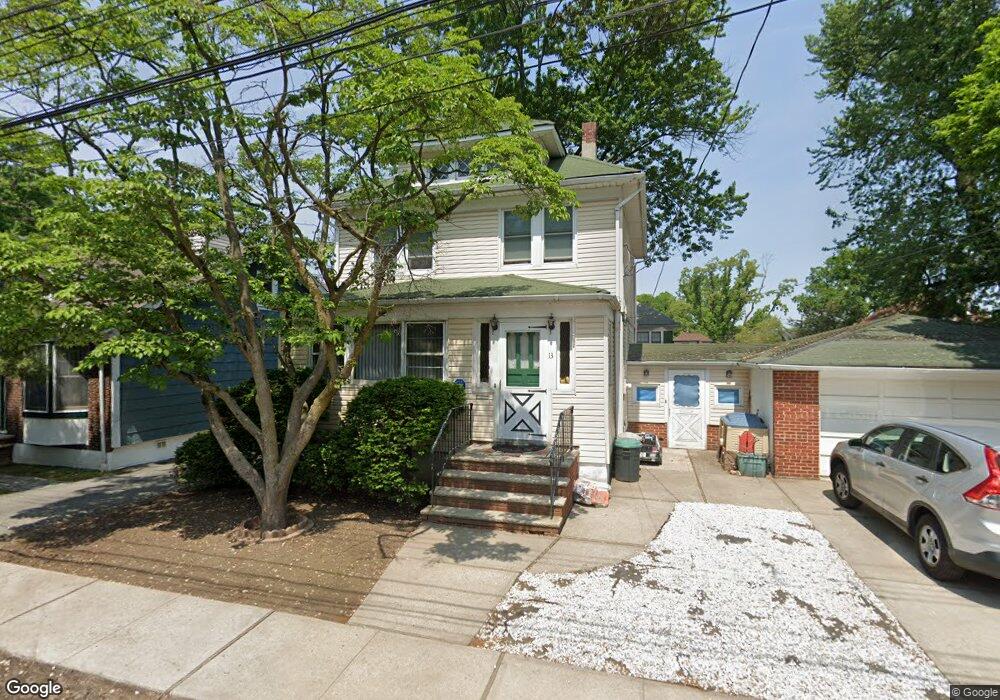
13 Ludwig St Staten Island, NY 10310
West Brighton NeighborhoodEstimated Value: $711,000 - $815,000
4
Beds
2
Baths
1,616
Sq Ft
$481/Sq Ft
Est. Value
About This Home
This home is located at 13 Ludwig St, Staten Island, NY 10310 and is currently estimated at $777,852, approximately $481 per square foot. 13 Ludwig St is a home located in Richmond County with nearby schools including P.S. 45 John Tyler, Intermediate School 27, and Curtis High School.
Ownership History
Date
Name
Owned For
Owner Type
Purchase Details
Closed on
Dec 12, 2016
Sold by
Bourke Maria Rose O
Bought by
Ryan Maureen
Current Estimated Value
Home Financials for this Owner
Home Financials are based on the most recent Mortgage that was taken out on this home.
Original Mortgage
$360,000
Outstanding Balance
$294,399
Interest Rate
3.94%
Mortgage Type
New Conventional
Estimated Equity
$483,453
Create a Home Valuation Report for This Property
The Home Valuation Report is an in-depth analysis detailing your home's value as well as a comparison with similar homes in the area
Home Values in the Area
Average Home Value in this Area
Purchase History
| Date | Buyer | Sale Price | Title Company |
|---|---|---|---|
| Ryan Maureen | $450,000 | Title Insurance Commitment |
Source: Public Records
Mortgage History
| Date | Status | Borrower | Loan Amount |
|---|---|---|---|
| Open | Ryan Maureen | $360,000 |
Source: Public Records
Tax History
| Year | Tax Paid | Tax Assessment Tax Assessment Total Assessment is a certain percentage of the fair market value that is determined by local assessors to be the total taxable value of land and additions on the property. | Land | Improvement |
|---|---|---|---|---|
| 2025 | $6,417 | $45,660 | $12,638 | $33,022 |
| 2024 | $6,417 | $40,200 | $13,542 | $26,658 |
| 2023 | $6,359 | $31,310 | $11,313 | $19,997 |
| 2022 | $6,199 | $42,780 | $17,040 | $25,740 |
| 2021 | $6,295 | $41,520 | $17,040 | $24,480 |
| 2020 | $7,114 | $37,500 | $17,040 | $20,460 |
| 2019 | $5,569 | $39,900 | $17,040 | $22,860 |
| 2018 | $5,319 | $26,092 | $13,903 | $12,189 |
| 2017 | $5,275 | $25,878 | $13,242 | $12,636 |
| 2016 | $4,983 | $24,927 | $12,848 | $12,079 |
| 2015 | $4,258 | $23,517 | $12,064 | $11,453 |
| 2014 | $4,258 | $22,186 | $11,480 | $10,706 |
Source: Public Records
Map
Nearby Homes
Your Personal Tour Guide
Ask me questions while you tour the home.