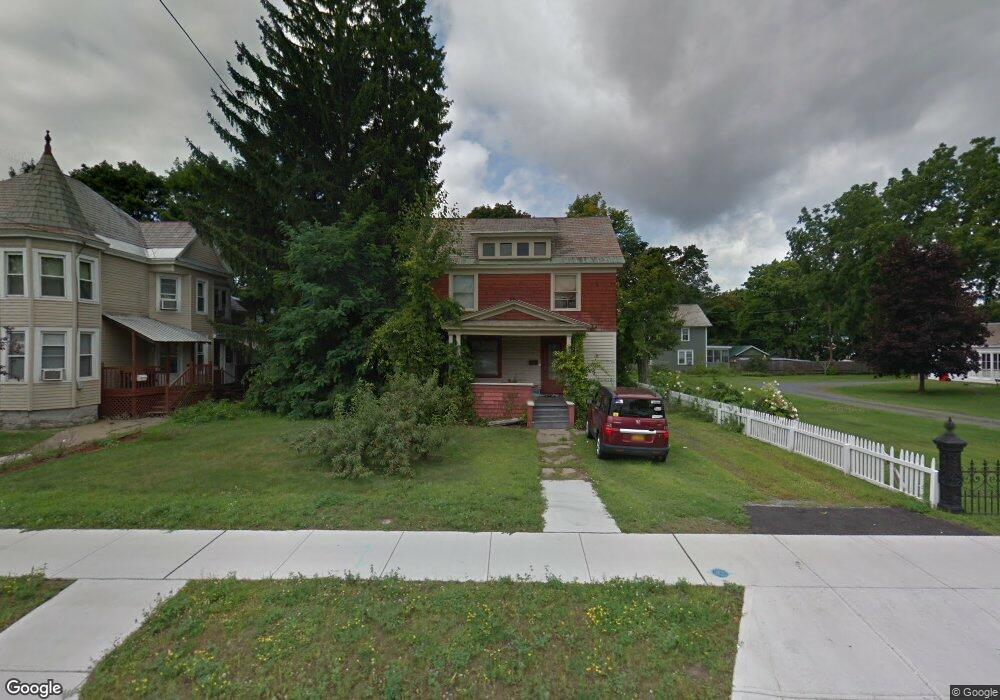
13 Main St Hudson Falls, NY 12839
Estimated Value: $208,000 - $247,000
3
Beds
1
Bath
2,120
Sq Ft
$105/Sq Ft
Est. Value
About This Home
This home is located at 13 Main St, Hudson Falls, NY 12839 and is currently estimated at $222,178, approximately $104 per square foot. 13 Main St is a home located in Washington County with nearby schools including Margaret Murphy Kindergarten Center, Hudson Falls Intermediate School, and Hudson Falls Primary School.
Ownership History
Date
Name
Owned For
Owner Type
Purchase Details
Closed on
Feb 4, 2021
Sold by
Smith Taylor
Bought by
Moore Brandon and Sears Jessica
Current Estimated Value
Home Financials for this Owner
Home Financials are based on the most recent Mortgage that was taken out on this home.
Original Mortgage
$168,099
Outstanding Balance
$150,085
Interest Rate
2.6%
Mortgage Type
VA
Estimated Equity
$72,093
Purchase Details
Closed on
Jul 2, 1998
Create a Home Valuation Report for This Property
The Home Valuation Report is an in-depth analysis detailing your home's value as well as a comparison with similar homes in the area
Home Values in the Area
Average Home Value in this Area
Purchase History
| Date | Buyer | Sale Price | Title Company |
|---|---|---|---|
| Moore Brandon | $164,320 | Misc Company | |
| -- | -- | -- |
Source: Public Records
Mortgage History
| Date | Status | Borrower | Loan Amount |
|---|---|---|---|
| Open | Moore Brandon | $168,099 |
Source: Public Records
Tax History
| Year | Tax Paid | Tax Assessment Tax Assessment Total Assessment is a certain percentage of the fair market value that is determined by local assessors to be the total taxable value of land and additions on the property. | Land | Improvement |
|---|---|---|---|---|
| 2024 | $4,278 | $187,300 | $12,000 | $175,300 |
| 2023 | $3,948 | $164,300 | $12,000 | $152,300 |
| 2022 | $4,560 | $164,300 | $12,000 | $152,300 |
| 2021 | $4,237 | $155,000 | $12,000 | $143,000 |
| 2020 | $3,400 | $114,000 | $12,000 | $102,000 |
| 2019 | $2,967 | $114,000 | $12,000 | $102,000 |
| 2018 | $2,967 | $114,000 | $11,800 | $102,200 |
| 2017 | $2,760 | $104,500 | $11,800 | $92,700 |
| 2016 | $2,776 | $104,500 | $11,800 | $92,700 |
| 2015 | -- | $106,600 | $11,800 | $94,800 |
| 2014 | -- | $108,800 | $11,800 | $97,000 |
Source: Public Records
Map
Nearby Homes
Your Personal Tour Guide
Ask me questions while you tour the home.