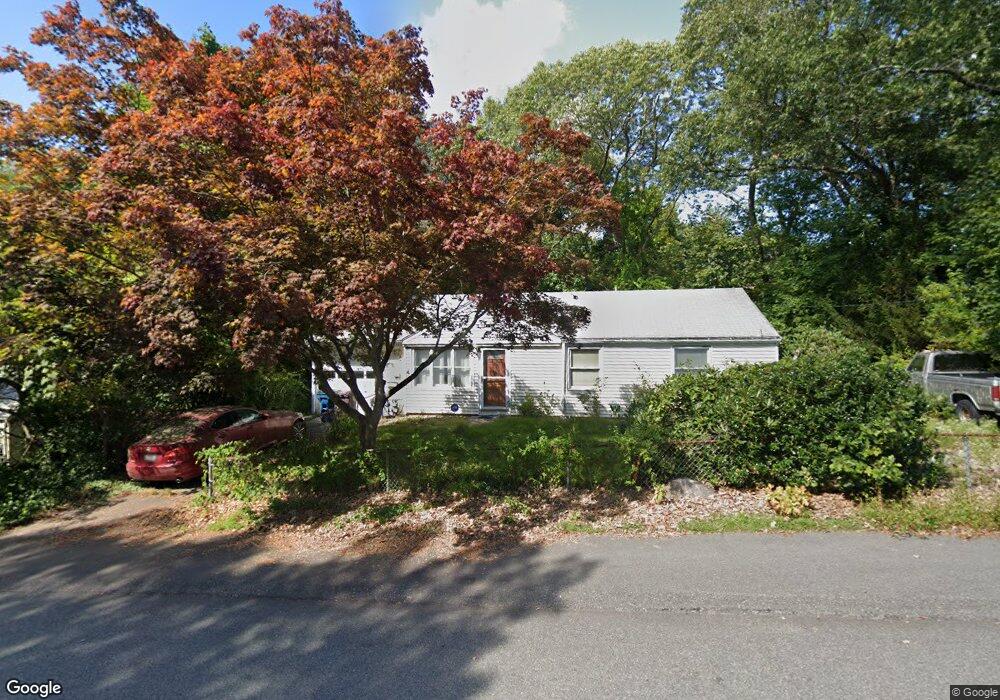
13 Mars St Weymouth, MA 02188
South Weymouth NeighborhoodEstimated Value: $499,000 - $543,000
About This Home
This home is located at 13 Mars St, Weymouth, MA 02188 and is currently estimated at $522,630, approximately $573 per square foot. 13 Mars St is a home located in Norfolk County with nearby schools including Thomas V Nash, Abigail Adams Middle School, and Weymouth Middle School Chapman.
Ownership History
We collect this data history from publicly available records. To have your information removed, we recommend requesting removal directly through your county’s website.
Purchase Details
Home Financials for this Owner
Home Financials are based on the most recent Mortgage that was taken out on this home.Home Values in the Area
Average Home Value in this Area
Purchase History
We collect this data history from publicly available records. To have your information removed, we recommend requesting removal directly through your county’s website.
| Date | Buyer | Sale Price | Title Company |
|---|---|---|---|
| $179,900 | -- |
Mortgage History
We collect this data history from publicly available records. To have your information removed, we recommend requesting removal directly through your county’s website.
| Date | Status | Borrower | Loan Amount |
|---|---|---|---|
| Open | $161,900 |
Tax History
We collect this data history from publicly available records. To have your information removed, we recommend requesting removal directly through your county’s website.
| Year | Tax Paid | Tax Assessment Tax Assessment Total Assessment is a certain percentage of the fair market value that is determined by local assessors to be the total taxable value of land and additions on the property. | Land | Improvement |
|---|---|---|---|---|
| 2025 | $4,469 | $442,500 | $208,000 | $234,500 |
| 2024 | $4,325 | $421,100 | $198,100 | $223,000 |
| 2023 | $4,115 | $393,800 | $183,400 | $210,400 |
| 2022 | $4,067 | $354,900 | $169,900 | $185,000 |
| 2021 | $3,718 | $316,700 | $169,900 | $146,800 |
| 2020 | $3,508 | $294,300 | $169,900 | $124,400 |
| 2019 | $3,409 | $281,300 | $163,300 | $118,000 |
| 2018 | $3,311 | $264,900 | $155,500 | $109,400 |
| 2017 | $3,204 | $250,100 | $148,200 | $101,900 |
| 2016 | $3,078 | $240,500 | $142,500 | $98,000 |
| 2015 | $3,008 | $233,200 | $142,500 | $90,700 |
| 2014 | $2,753 | $207,000 | $119,300 | $87,700 |
Map
- 35 Southern Ave
- 92 Mercury St
- 501 Commerce Dr Unit 2204
- 501 Commerce Dr Unit 308
- 501 Commerce Dr Unit 2105
- 501 Commerce Dr Unit 4308
- 501 Commerce Dr Unit 3119
- 501 Commerce Dr Unit 3113
- 501 Commerce Dr Unit 1210
- 169 Park Ave W
- 630 Main St
- 28 Park Ave W
- 12 Griffin Terrace
- 894 Liberty St Unit 10
- 894 Liberty St Unit 6
- 740-742 Main St
- 267 Allerton Commons Ln
- 20 Teaberry Ln Unit 1
- 377 Summer St
- 50 Sherricks Farm Rd
Ask me questions while you tour the home.