Estimated Value: $616,000 - $736,000
1
Bed
1
Bath
730
Sq Ft
$937/Sq Ft
Est. Value
About This Home
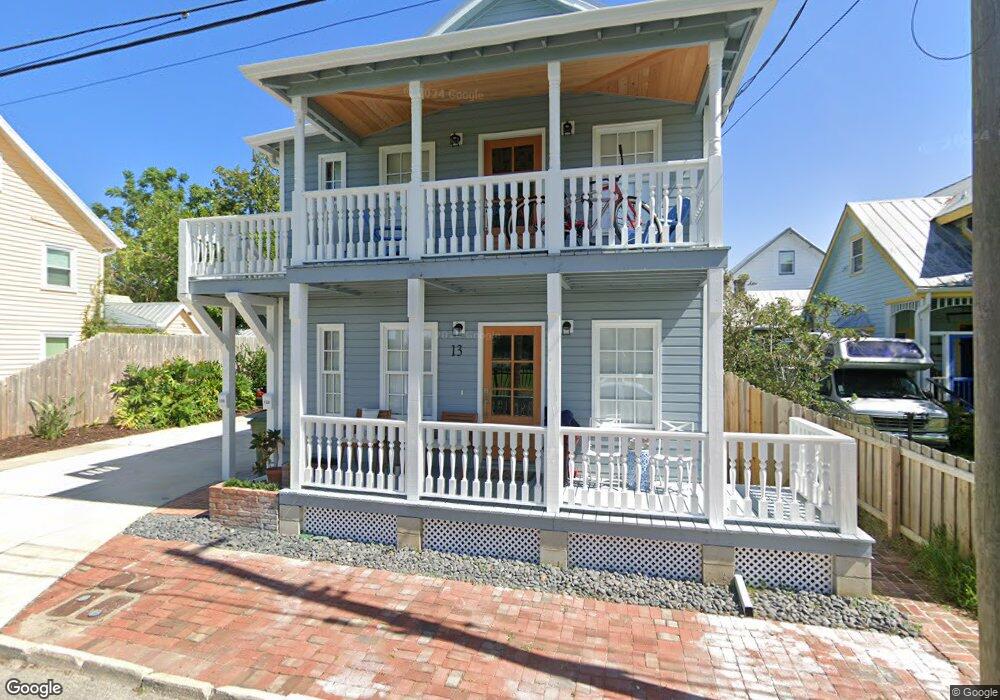
This home is located at 13 Pine St, Saint Augustine, FL 32084 and is currently estimated at $684,224, approximately $937 per square foot. 13 Pine St is a home located in St. Johns County with nearby schools including Ketterlinus Elementary School, Sebastian Middle School, and St. Augustine High School.
Ownership History
Date
Name
Owned For
Owner Type
Purchase Details
Closed on
Nov 17, 2021
Sold by
San Marco Antique Mall Inc
Bought by
Barlow William J
Current Estimated Value
Home Financials for this Owner
Home Financials are based on the most recent Mortgage that was taken out on this home.
Original Mortgage
$248,000
Outstanding Balance
$227,249
Interest Rate
2.99%
Mortgage Type
New Conventional
Estimated Equity
$456,975
Purchase Details
Closed on
Apr 10, 2015
Sold by
Cogan John J
Bought by
San Marco Antique Mall Inc
Purchase Details
Closed on
Mar 28, 2000
Sold by
Sabrina Baksh and Baksh Sabrina Baksh
Bought by
Cogan John J
Home Financials for this Owner
Home Financials are based on the most recent Mortgage that was taken out on this home.
Original Mortgage
$132,000
Interest Rate
8.38%
Mortgage Type
Commercial
Create a Home Valuation Report for This Property
The Home Valuation Report is an in-depth analysis detailing your home's value as well as a comparison with similar homes in the area
Home Values in the Area
Average Home Value in this Area
Purchase History
| Date | Buyer | Sale Price | Title Company |
|---|---|---|---|
| Barlow William J | $498,000 | Estate Ttl Of St Augustine I | |
| San Marco Antique Mall Inc | $310,000 | Estate Title Of St Augustine | |
| Cogan John J | $165,000 | Estate Title & Guaranty Inc |
Source: Public Records
Mortgage History
| Date | Status | Borrower | Loan Amount |
|---|---|---|---|
| Open | Barlow William J | $248,000 | |
| Previous Owner | Cogan John J | $132,000 | |
| Closed | Cogan John J | $16,500 |
Source: Public Records
Tax History
| Year | Tax Paid | Tax Assessment Tax Assessment Total Assessment is a certain percentage of the fair market value that is determined by local assessors to be the total taxable value of land and additions on the property. | Land | Improvement |
|---|---|---|---|---|
| 2025 | $9,245 | $558,520 | $170,352 | $388,168 |
| 2024 | $9,245 | $534,277 | $170,352 | $363,925 |
| 2023 | $9,245 | $519,535 | $155,610 | $363,925 |
| 2022 | $8,203 | $427,270 | $155,938 | $271,332 |
| 2021 | $5,560 | $282,620 | $0 | $0 |
| 2020 | $5,965 | $301,130 | $0 | $0 |
| 2019 | $5,878 | $288,411 | $0 | $0 |
| 2018 | $5,889 | $292,285 | $0 | $0 |
| 2017 | $5,378 | $259,109 | $111,384 | $147,725 |
| 2016 | $5,298 | $249,281 | $0 | $0 |
| 2015 | $3,755 | $174,477 | $0 | $0 |
| 2014 | $3,438 | $154,215 | $0 | $0 |
Source: Public Records
Map
Nearby Homes
Your Personal Tour Guide
Ask me questions while you tour the home.