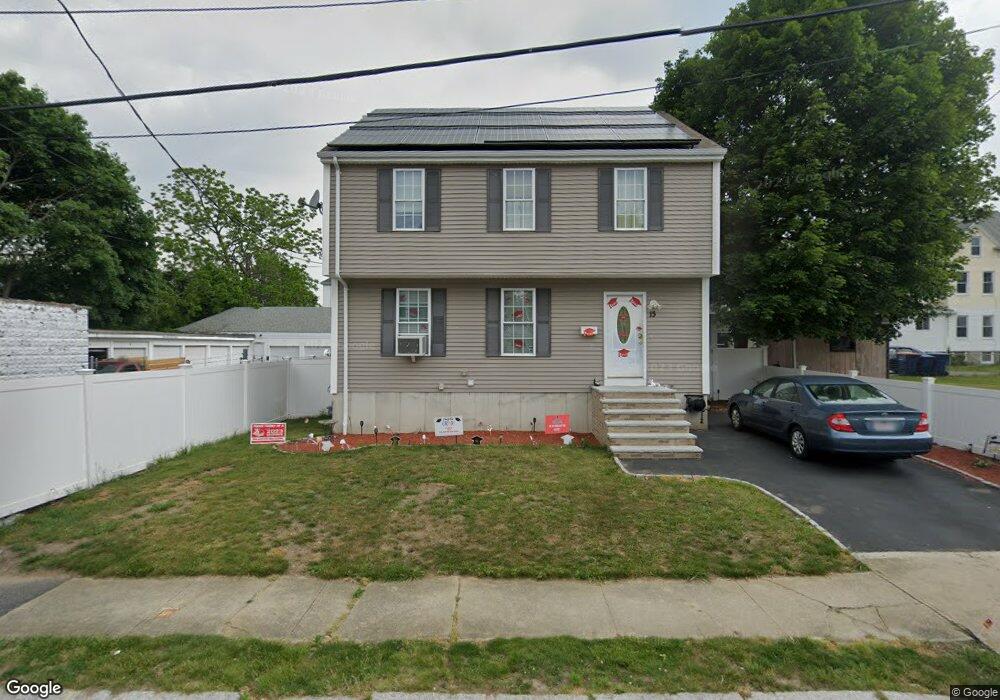
13 Trinity St New Bedford, MA 02740
Clasky Park NeighborhoodEstimated Value: $417,667 - $478,000
3
Beds
2
Baths
1,500
Sq Ft
$294/Sq Ft
Est. Value
About This Home
This home is located at 13 Trinity St, New Bedford, MA 02740 and is currently estimated at $441,667, approximately $294 per square foot. 13 Trinity St is a home located in Bristol County with nearby schools including John Avery Parker, Keith Middle School, and New Bedford High School.
Ownership History
Date
Name
Owned For
Owner Type
Purchase Details
Closed on
Jun 24, 2009
Sold by
Sovereign Bk
Bought by
Nickerson Paul L
Current Estimated Value
Home Financials for this Owner
Home Financials are based on the most recent Mortgage that was taken out on this home.
Original Mortgage
$192,449
Interest Rate
4.92%
Mortgage Type
Purchase Money Mortgage
Purchase Details
Closed on
Feb 5, 2009
Sold by
Padilla Hernan E
Bought by
Sovereign Bk
Purchase Details
Closed on
Jul 15, 2004
Sold by
Cardoso Kevin
Bought by
Padilla Hernan E
Create a Home Valuation Report for This Property
The Home Valuation Report is an in-depth analysis detailing your home's value as well as a comparison with similar homes in the area
Home Values in the Area
Average Home Value in this Area
Purchase History
| Date | Buyer | Sale Price | Title Company |
|---|---|---|---|
| Nickerson Paul L | $196,000 | -- | |
| Nickerson Paul L | $196,000 | -- | |
| Sovereign Bk | $156,000 | -- | |
| Sovereign Bk | $156,000 | -- | |
| Padilla Hernan E | $219,900 | -- |
Source: Public Records
Mortgage History
| Date | Status | Borrower | Loan Amount |
|---|---|---|---|
| Open | Padilla Hernan E | $184,072 | |
| Closed | Padilla Hernan E | $192,449 |
Source: Public Records
Tax History
| Year | Tax Paid | Tax Assessment Tax Assessment Total Assessment is a certain percentage of the fair market value that is determined by local assessors to be the total taxable value of land and additions on the property. | Land | Improvement |
|---|---|---|---|---|
| 2025 | $4,363 | $385,800 | $92,400 | $293,400 |
| 2024 | $4,062 | $338,500 | $85,800 | $252,700 |
| 2023 | $4,491 | $314,300 | $72,600 | $241,700 |
| 2022 | $3,980 | $256,100 | $66,000 | $190,100 |
| 2021 | $3,753 | $240,700 | $62,700 | $178,000 |
| 2020 | $3,705 | $229,300 | $62,700 | $166,600 |
| 2019 | $3,587 | $217,800 | $62,700 | $155,100 |
| 2018 | $3,331 | $200,300 | $62,700 | $137,600 |
| 2017 | $3,188 | $191,000 | $61,000 | $130,000 |
| 2016 | $3,098 | $187,900 | $59,400 | $128,500 |
| 2015 | $2,907 | $184,800 | $59,400 | $125,400 |
| 2014 | $2,765 | $182,400 | $57,700 | $124,700 |
Source: Public Records
Map
Nearby Homes
- 407 Cedar St
- 17 Trinity St
- 411 Cedar St
- 000 Trinity Street (North Side)
- 12 Trinity St
- 27 Trinity St
- 397 Cedar St Unit 399
- 413 Cedar St
- 54 Durfee St
- 50 Durfee St
- 395 Cedar St
- 18 Trinity St
- 56 Durfee St
- 20 Trinity St
- 438 Cedar St Unit 2
- 415 Cedar St
- 408 Cedar St
- 28 Trinity St
- 28 Trinity St Unit 1
- 389 Cedar St
Your Personal Tour Guide
Ask me questions while you tour the home.