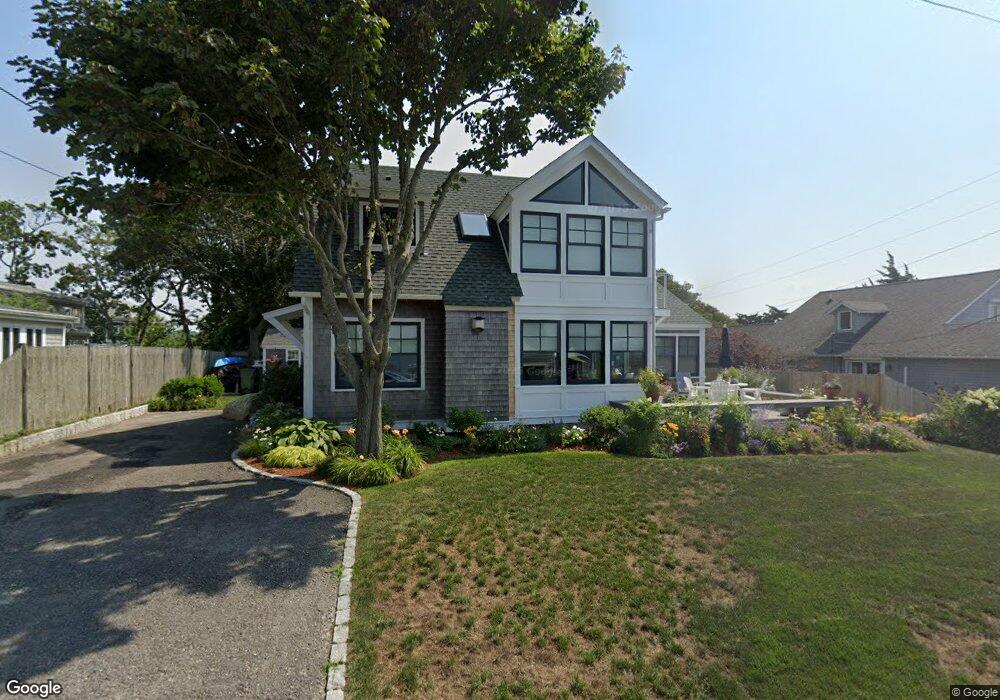
13 West Ave Marion, MA 02738
Estimated Value: $1,019,000 - $1,578,000
3
Beds
2
Baths
1,056
Sq Ft
$1,205/Sq Ft
Est. Value
About This Home
This home is located at 13 West Ave, Marion, MA 02738 and is currently estimated at $1,272,734, approximately $1,205 per square foot. 13 West Ave is a home located in Plymouth County with nearby schools including Old Rochester Regional High School.
Ownership History
Date
Name
Owned For
Owner Type
Purchase Details
Closed on
May 15, 2025
Sold by
Perry Anne B
Bought by
Anne B Perry Lt and Perry
Current Estimated Value
Purchase Details
Closed on
Dec 18, 2017
Sold by
Perry H Bradlee
Bought by
Perry Anne B
Purchase Details
Closed on
Nov 22, 2011
Sold by
Jackson Anne P
Bought by
Perry H B
Purchase Details
Closed on
Sep 30, 1993
Sold by
Connelly A Philip A and Connelly Judith M
Bought by
Jackson Perry H and Jackson Anne P
Create a Home Valuation Report for This Property
The Home Valuation Report is an in-depth analysis detailing your home's value as well as a comparison with similar homes in the area
Purchase History
| Date | Buyer | Sale Price | Title Company |
|---|---|---|---|
| Anne B Perry Lt | -- | None Available | |
| Perry Anne B | -- | -- | |
| Perry H B | $300,000 | -- | |
| Perry H B | $300,000 | -- | |
| Jackson Perry H | $223,500 | -- |
Source: Public Records
Mortgage History
| Date | Status | Borrower | Loan Amount |
|---|---|---|---|
| Previous Owner | Jackson Perry H | $146,000 | |
| Previous Owner | Jackson Perry H | $150,000 |
Source: Public Records
Tax History
| Year | Tax Paid | Tax Assessment Tax Assessment Total Assessment is a certain percentage of the fair market value that is determined by local assessors to be the total taxable value of land and additions on the property. | Land | Improvement |
|---|---|---|---|---|
| 2025 | $10,411 | $1,117,079 | $716,779 | $400,300 |
| 2024 | $9,648 | $1,041,950 | $654,450 | $387,500 |
| 2023 | $9,097 | $963,704 | $607,704 | $356,000 |
| 2022 | $10,632 | $979,892 | $643,992 | $335,900 |
| 2021 | $9,993 | $882,786 | $568,786 | $314,000 |
| 2020 | $8,804 | $752,500 | $454,100 | $298,400 |
| 2019 | $7,250 | $657,300 | $413,400 | $243,900 |
| 2018 | $6,232 | $544,300 | $418,200 | $126,100 |
| 2017 | $6,118 | $536,200 | $418,200 | $118,000 |
| 2016 | $6,101 | $539,400 | $418,200 | $121,200 |
| 2015 | $5,749 | $517,500 | $412,300 | $105,200 |
Source: Public Records
Map
Nearby Homes
- 56 E Ave & Lot 27 West Ave
- 414 Point Rd
- 44 Register Rd
- 0 Register Rd
- 91 Piney Point Rd
- 16 Spinnaker Ln
- 15 Quelle Ln
- 13 Converse Rd
- 58 Delano Rd
- 12 Kabeyun Rd
- 85 Moorings Rd
- 0 Rd Unit 73474504
- 16 Vine St
- 174 Cross Neck Rd
- 7 Upland Way
- 13 Cottage St
- 4 Olde Logging Rd
- 81 Aucoot Rd
- 7 Cedar St
- 701 Mill St
Your Personal Tour Guide
Ask me questions while you tour the home.