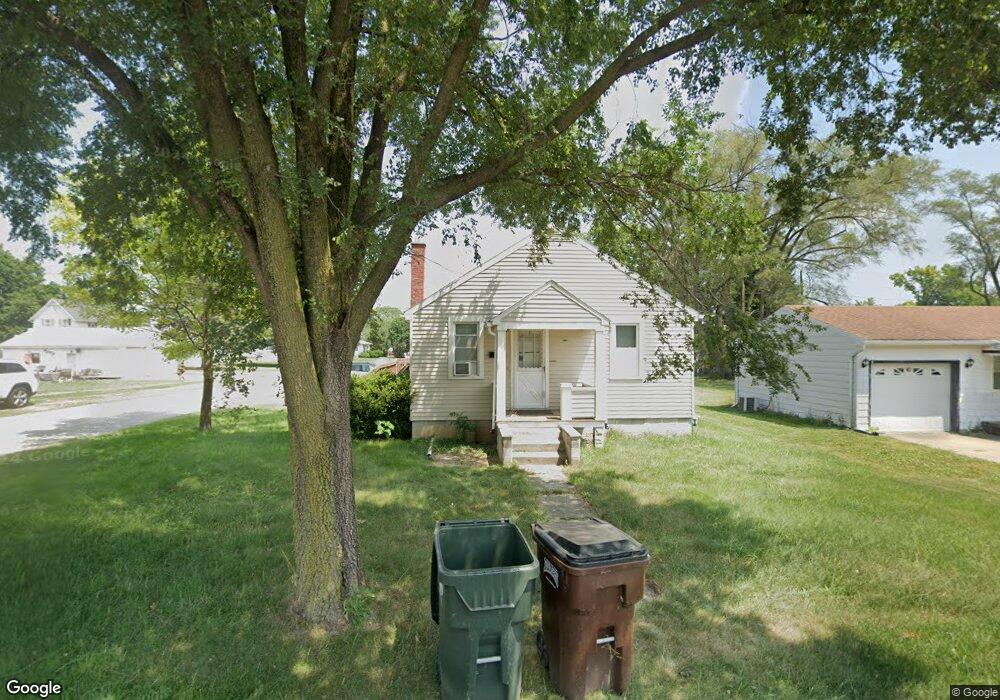
130 3rd Ave Tiffin, OH 44883
Estimated Value: $101,460 - $151,000
3
Beds
1
Bath
1,304
Sq Ft
$102/Sq Ft
Est. Value
About This Home
This home is located at 130 3rd Ave, Tiffin, OH 44883 and is currently estimated at $132,365, approximately $101 per square foot. 130 3rd Ave is a home located in Seneca County with nearby schools including Columbian High School, Calvert Catholic Elementary School, and Calvert High School.
Ownership History
Date
Name
Owned For
Owner Type
Purchase Details
Closed on
Dec 30, 2004
Sold by
Cornett Norma J and Cornett Odis
Bought by
Merchant Jacqueline M
Current Estimated Value
Home Financials for this Owner
Home Financials are based on the most recent Mortgage that was taken out on this home.
Original Mortgage
$64,800
Outstanding Balance
$31,749
Interest Rate
5.82%
Mortgage Type
New Conventional
Estimated Equity
$100,616
Purchase Details
Closed on
Oct 1, 1988
Purchase Details
Closed on
Feb 1, 1988
Create a Home Valuation Report for This Property
The Home Valuation Report is an in-depth analysis detailing your home's value as well as a comparison with similar homes in the area
Home Values in the Area
Average Home Value in this Area
Purchase History
| Date | Buyer | Sale Price | Title Company |
|---|---|---|---|
| Merchant Jacqueline M | $72,000 | None Available | |
| -- | $20,000 | -- | |
| -- | $21,300 | -- |
Source: Public Records
Mortgage History
| Date | Status | Borrower | Loan Amount |
|---|---|---|---|
| Open | Merchant Jacqueline M | $64,800 |
Source: Public Records
Tax History
| Year | Tax Paid | Tax Assessment Tax Assessment Total Assessment is a certain percentage of the fair market value that is determined by local assessors to be the total taxable value of land and additions on the property. | Land | Improvement |
|---|---|---|---|---|
| 2025 | $854 | $25,210 | $3,530 | $21,680 |
| 2024 | $851 | $25,210 | $3,530 | $21,680 |
| 2023 | $851 | $25,210 | $3,530 | $21,680 |
| 2022 | $770 | $18,920 | $2,950 | $15,970 |
| 2021 | $776 | $18,920 | $2,950 | $15,970 |
| 2020 | $790 | $18,925 | $2,951 | $15,974 |
| 2019 | $815 | $18,865 | $2,940 | $15,925 |
| 2018 | $817 | $18,865 | $2,940 | $15,925 |
| 2017 | $825 | $18,865 | $2,940 | $15,925 |
| 2016 | $900 | $17,704 | $2,853 | $14,851 |
| 2015 | $746 | $17,704 | $2,853 | $14,851 |
| 2014 | $703 | $17,704 | $2,853 | $14,851 |
| 2013 | $752 | $18,249 | $2,940 | $15,309 |
Source: Public Records
Map
Nearby Homes
- 225 4th Ave
- 131 Park Ave
- 241 Hall St
- 66 N Sandusky St
- 109 -111 Wall St
- 109 Wall St
- 117 E Perry St
- 332 Elm Ave
- 112 Liberty St
- 0 Miami St Unit 10003054
- 0 Miami St Unit Parcel 2
- 0 Miami St Unit 20260131
- 127 Wentz St
- 2695 Ohio 18
- 0 Township Road 198a Unit Parcel 4
- 0 Township Road 198a Unit 10003057
- 0 W Tr 198a Unit 20260135
- 65 Elmwood St
- 376 E Perry St
- 60 N State Route 101 Unit 14
Your Personal Tour Guide
Ask me questions while you tour the home.