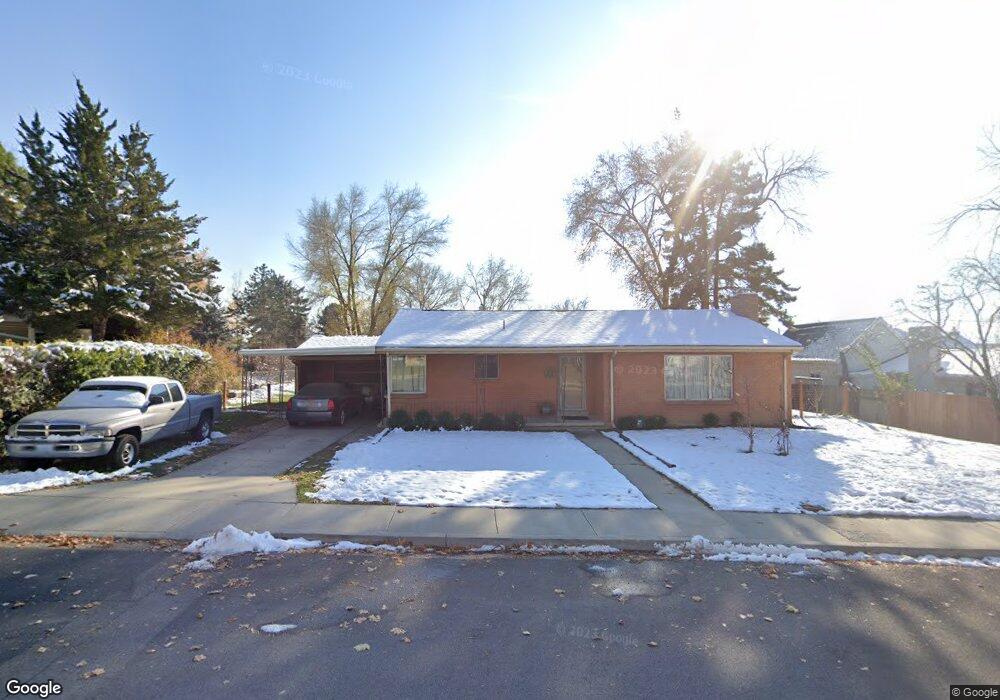
130 E 200 N Pleasant Grove, UT 84062
Estimated Value: $449,000 - $550,000
3
Beds
2
Baths
2,468
Sq Ft
$202/Sq Ft
Est. Value
About This Home
This home is located at 130 E 200 N, Pleasant Grove, UT 84062 and is currently estimated at $498,094, approximately $201 per square foot. 130 E 200 N is a home located in Utah County with nearby schools including Central Elementary School, Pleasant Grove Junior High School, and Pleasant Grove High School.
Ownership History
Date
Name
Owned For
Owner Type
Purchase Details
Closed on
Jan 22, 2024
Sold by
130 E 200 N Revocable Trust and Green Anderson Sharon
Bought by
Sharon Green Anderson Family Trust and Anderson
Current Estimated Value
Purchase Details
Closed on
Jul 2, 2018
Sold by
Winslow Ernest P and Ernest P Winslow Sr Revocable
Bought by
Anderson Sharon and The 130 E 200 N Revocable Trus
Purchase Details
Closed on
Apr 4, 2002
Sold by
Winslow Ernest P
Bought by
Winslow Ernest P and Ernest P Winslow Sr Revocable
Purchase Details
Closed on
Feb 27, 2002
Sold by
Winslow Sherry Sue
Bought by
Winslow Ernest P
Create a Home Valuation Report for This Property
The Home Valuation Report is an in-depth analysis detailing your home's value as well as a comparison with similar homes in the area
Home Values in the Area
Average Home Value in this Area
Purchase History
We collect this data history from publicly available records. To have your information removed, we recommend requesting removal directly through your county’s website.
| Date | Buyer | Sale Price | Title Company |
|---|---|---|---|
| Sharon Green Anderson Family Trust | -- | None Listed On Document | |
| Anderson Sharon | -- | Vanguard Title Ins Agcy Llc | |
| Winslow Ernest P | -- | -- | |
| Winslow Ernest P | -- | -- |
Source: Public Records
Tax History
| Year | Tax Paid | Tax Assessment Tax Assessment Total Assessment is a certain percentage of the fair market value that is determined by local assessors to be the total taxable value of land and additions on the property. | Land | Improvement |
|---|---|---|---|---|
| 2025 | $1,893 | $245,795 | -- | -- |
| 2024 | $1,762 | $220,935 | $0 | $0 |
| 2023 | $2,006 | $215,325 | $0 | $0 |
| 2022 | $2,006 | $243,870 | $0 | $0 |
| 2021 | $1,730 | $320,300 | $154,300 | $166,000 |
| 2020 | $1,591 | $288,700 | $137,800 | $150,900 |
| 2019 | $1,400 | $262,700 | $126,700 | $136,000 |
| 2018 | $1,360 | $241,300 | $115,500 | $125,800 |
| 2017 | $1,201 | $113,465 | $0 | $0 |
| 2016 | $1,152 | $105,105 | $0 | $0 |
| 2015 | $1,127 | $97,295 | $0 | $0 |
| 2014 | $1,092 | $93,390 | $0 | $0 |
Source: Public Records
Map
Nearby Homes
- 90 N 200 E
- 77 N Main St
- 125 N 100 W
- 190 E 100 S
- 165 S 200 E
- 382 W 330 N
- 75 S 500 E
- 412 S 350 E
- 557 E 200 N Unit 2
- 424 E 420 S
- 110 E State Rd Unit 123A
- 535 S 300 E
- 595 E 200 S
- 641 E 700 N
- 675 S Main St
- 451 E Apple Grove Ln
- 151 S Pleasant Grove Blvd
- 310 W 1100 N
- 449 E Apple Blossom Dr
- 165 S Pleasant Grove Blvd Unit 39
Your Personal Tour Guide
Ask me questions while you tour the home.