Estimated Value: $80,000 - $95,000
2
Beds
3
Baths
1,120
Sq Ft
$80/Sq Ft
Est. Value
About This Home
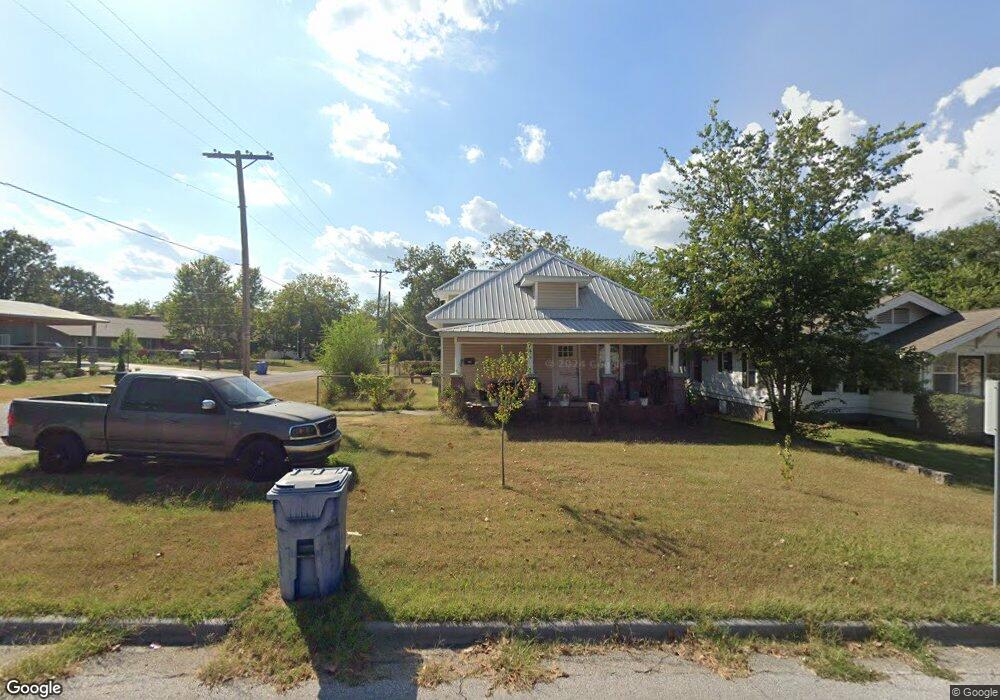
This home is located at 130 E St SW, Miami, OK 74354 and is currently estimated at $90,000, approximately $80 per square foot. 130 E St SW is a home located in Ottawa County with nearby schools including Miami High School and Mt Olive Lutheran School.
Ownership History
Date
Name
Owned For
Owner Type
Purchase Details
Closed on
Oct 1, 2018
Sold by
Stanton Jon D and Stanton Marianne
Bought by
Staggs Rocky Ty Dak
Current Estimated Value
Home Financials for this Owner
Home Financials are based on the most recent Mortgage that was taken out on this home.
Original Mortgage
$42,260
Outstanding Balance
$36,777
Interest Rate
4.5%
Mortgage Type
Construction
Estimated Equity
$53,223
Purchase Details
Closed on
Dec 29, 2008
Sold by
Mann Joyce Ellen
Bought by
Stanton Jon D and Stanton Marianne
Purchase Details
Closed on
Oct 2, 1996
Bought by
Turley Marlin and Turley Shounda
Create a Home Valuation Report for This Property
The Home Valuation Report is an in-depth analysis detailing your home's value as well as a comparison with similar homes in the area
Purchase History
We collect this data history from publicly available records. To have your information removed, we recommend requesting removal directly through your county’s website.
| Date | Buyer | Sale Price | Title Company |
|---|---|---|---|
| Staggs Rocky Ty Dak | $30,000 | None Available | |
| Stanton Jon D | $56,000 | None Available | |
| Turley Marlin | $25,000 | -- |
Source: Public Records
Mortgage History
We collect this data history from publicly available records. To have your information removed, we recommend requesting removal directly through your county’s website.
| Date | Status | Borrower | Loan Amount |
|---|---|---|---|
| Open | Staggs Rocky Ty Dak | $42,260 |
Source: Public Records
Tax History
| Year | Tax Paid | Tax Assessment Tax Assessment Total Assessment is a certain percentage of the fair market value that is determined by local assessors to be the total taxable value of land and additions on the property. | Land | Improvement |
|---|---|---|---|---|
| 2025 | $461 | $4,786 | $228 | $4,558 |
| 2024 | $519 | $5,386 | $228 | $5,158 |
| 2023 | $519 | $5,336 | $228 | $5,108 |
| 2022 | $470 | $5,082 | $228 | $4,854 |
| 2021 | $457 | $4,840 | $228 | $4,612 |
| 2020 | $439 | $4,610 | $228 | $4,382 |
| 2019 | $363 | $4,418 | $228 | $4,190 |
| 2018 | $424 | $5,131 | $228 | $4,903 |
| 2017 | $431 | $5,131 | $228 | $4,903 |
| 2016 | $427 | $5,316 | $228 | $5,088 |
| 2015 | $246 | $2,765 | $285 | $2,480 |
| 2014 | $523 | $6,384 | $228 | $6,156 |
Source: Public Records
Map
Nearby Homes
Your Personal Tour Guide
Ask me questions while you tour the home.