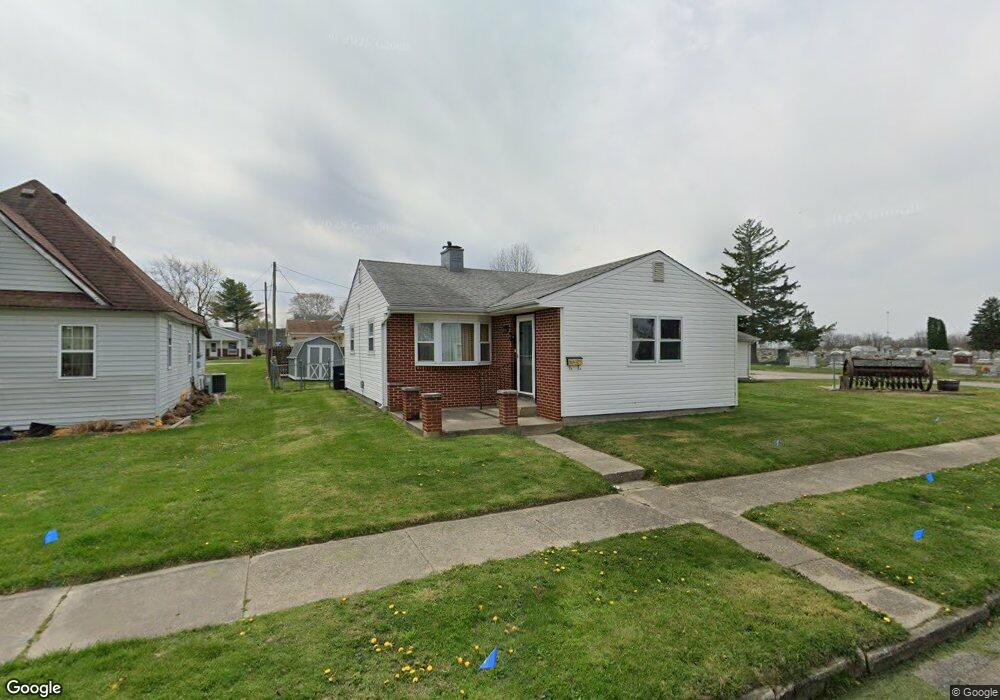
1303 S E St Elwood, IN 46036
Estimated Value: $77,785 - $123,000
2
Beds
1
Bath
966
Sq Ft
$101/Sq Ft
Est. Value
About This Home
This home is located at 1303 S E St, Elwood, IN 46036 and is currently estimated at $97,446, approximately $100 per square foot. 1303 S E St is a home located in Madison County with nearby schools including Elwood Elementary School, Elwood Intermediate School, and Elwood Junior-Senior High School.
Ownership History
Date
Name
Owned For
Owner Type
Purchase Details
Closed on
Apr 8, 2026
Sold by
Murray Larry
Bought by
Israel Ashley
Current Estimated Value
Home Financials for this Owner
Home Financials are based on the most recent Mortgage that was taken out on this home.
Original Mortgage
$130,099
Outstanding Balance
$130,099
Interest Rate
5.98%
Mortgage Type
FHA
Estimated Equity
-$32,653
Purchase Details
Closed on
Nov 10, 2021
Sold by
Murray Larry R
Bought by
Murray Larry R and Murray Larry R
Create a Home Valuation Report for This Property
The Home Valuation Report is an in-depth analysis detailing your home's value as well as a comparison with similar homes in the area
Home Values in the Area
Average Home Value in this Area
Purchase History
| Date | Buyer | Sale Price | Title Company |
|---|---|---|---|
| Israel Ashley | -- | Fidelity National Title | |
| Murray Larry R | -- | None Listed On Document |
Source: Public Records
Mortgage History
| Date | Status | Borrower | Loan Amount |
|---|---|---|---|
| Open | Israel Ashley | $130,099 |
Source: Public Records
Tax History
| Year | Tax Paid | Tax Assessment Tax Assessment Total Assessment is a certain percentage of the fair market value that is determined by local assessors to be the total taxable value of land and additions on the property. | Land | Improvement |
|---|---|---|---|---|
| 2025 | $868 | $50,600 | $9,700 | $40,900 |
| 2024 | $868 | $43,400 | $9,700 | $33,700 |
| 2023 | $801 | $39,700 | $9,200 | $30,500 |
| 2022 | $805 | $39,400 | $8,900 | $30,500 |
| 2021 | $747 | $44,800 | $8,900 | $35,900 |
| 2020 | $452 | $42,800 | $8,500 | $34,300 |
| 2019 | $442 | $41,800 | $8,500 | $33,300 |
| 2018 | $416 | $39,600 | $8,500 | $31,100 |
| 2017 | $401 | $39,100 | $8,500 | $30,600 |
| 2016 | $407 | $38,700 | $8,500 | $30,200 |
| 2014 | $392 | $38,200 | $8,500 | $29,700 |
| 2013 | $392 | $38,200 | $8,500 | $29,700 |
Source: Public Records
Map
Nearby Homes
Your Personal Tour Guide
Ask me questions while you tour the home.