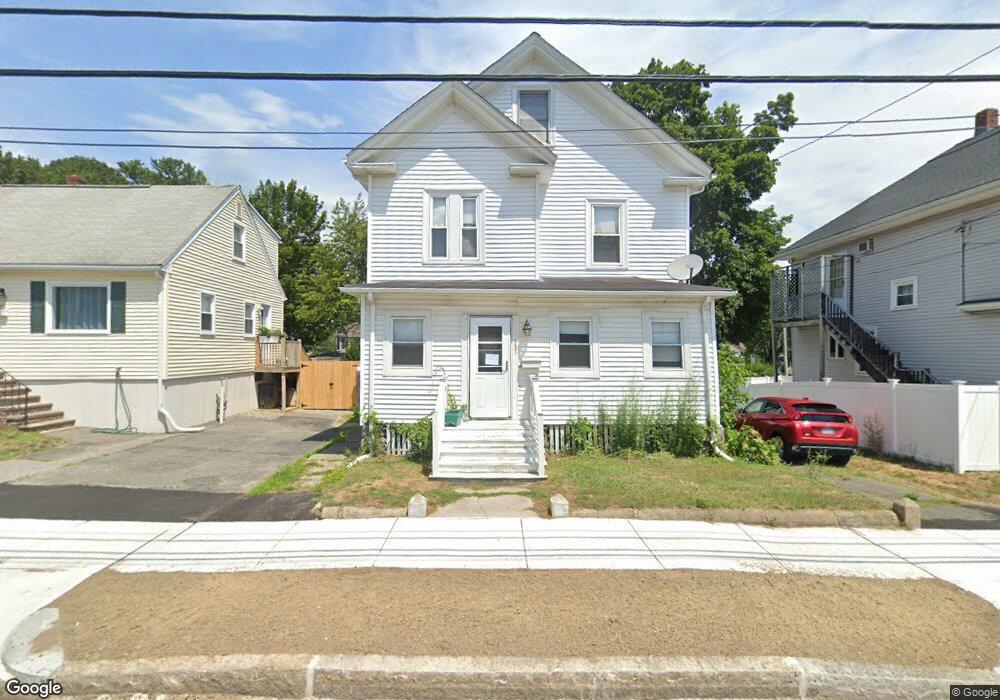
131 Bridge St Salem, MA 01970
Salem Common NeighborhoodEstimated Value: $1,043,477 - $1,601,000
About This Home
This home is located at 131 Bridge St, Salem, MA 01970 and is currently estimated at $1,233,119, approximately $261 per square foot. 131 Bridge St is a home located in Essex County with nearby schools including Carlton Elementary School, Saltonstall School, and Bates Elementary School.
Ownership History
We collect this data history from publicly available records. To have your information removed, we recommend requesting removal directly through your county’s website.
Purchase Details
Purchase Details
Home Financials for this Owner
Home Financials are based on the most recent Mortgage that was taken out on this home.Home Values in the Area
Average Home Value in this Area
Purchase History
We collect this data history from publicly available records. To have your information removed, we recommend requesting removal directly through your county’s website.
| Date | Buyer | Sale Price | Title Company |
|---|---|---|---|
| -- | None Available | ||
| $435,000 | -- |
Mortgage History
We collect this data history from publicly available records. To have your information removed, we recommend requesting removal directly through your county’s website.
| Date | Status | Borrower | Loan Amount |
|---|---|---|---|
| Previous Owner | $408,000 | ||
| Previous Owner | $102,000 | ||
| Previous Owner | $348,000 | ||
| Previous Owner | $87,000 |
Tax History
We collect this data history from publicly available records. To have your information removed, we recommend requesting removal directly through your county’s website.
| Year | Tax Paid | Tax Assessment Tax Assessment Total Assessment is a certain percentage of the fair market value that is determined by local assessors to be the total taxable value of land and additions on the property. | Land | Improvement |
|---|---|---|---|---|
| 2025 | $11,072 | $976,400 | $168,000 | $808,400 |
| 2024 | $10,147 | $873,200 | $168,000 | $705,200 |
| 2023 | $9,661 | $772,300 | $148,200 | $624,100 |
| 2022 | $9,883 | $745,900 | $138,300 | $607,600 |
| 2021 | $9,283 | $672,700 | $129,100 | $543,600 |
| 2020 | $9,290 | $642,900 | $133,700 | $509,200 |
| 2019 | $9,090 | $602,000 | $121,900 | $480,100 |
| 2018 | $8,110 | $527,300 | $105,400 | $421,900 |
| 2017 | $7,567 | $477,100 | $84,300 | $392,800 |
| 2016 | $5,397 | $344,400 | $84,300 | $260,100 |
| 2015 | $5,181 | $315,700 | $72,500 | $243,200 |
Map
- 7 1/2 Pleasant St
- 20 Winter St
- 12 Northey St
- 106 Bridge St Unit 7
- 106 Bridge St Unit 2
- 35 Washington Square Unit 3
- 31 Williams St
- 15 1/2 Williams St Unit 2
- 7 Howard St Unit 4
- 33 Essex St Unit 1
- 1 Turner St Unit 1
- 49 Essex St Unit 2R
- 129 Essex St Unit 8
- 10 Daniels St Unit 2
- 10 1/2 Herbert St Unit 21
- 8 Burnside St Unit 2
- 11 Church St Unit 101
- 11 Church St Unit 111
- 17 Osgood St
- 149 Derby St Unit C
- 1 Parker Ct
- 18 Pleasant St
- 3 Parker Ct
- 20 Pleasant St
- 4 Parker Ct
- 0 Pleasant St Unit 1
- 14 Pleasant St
- 19 Pleasant St Unit 3
- 19 Pleasant St
- 17 Pleasant St Unit 2
- 17 Pleasant St Unit 1
- 25 Pleasant St Unit 1
- 25 Pleasant St Unit 2
- 25 Pleasant St
- 12 Pleasant St
- 19 & 21 Pleasant St
- 23 Pleasant St
- 23 Pleasant St Unit 23
- 23 Pleasant St Unit 1
- 15 Pleasant St
Ask me questions while you tour the home.