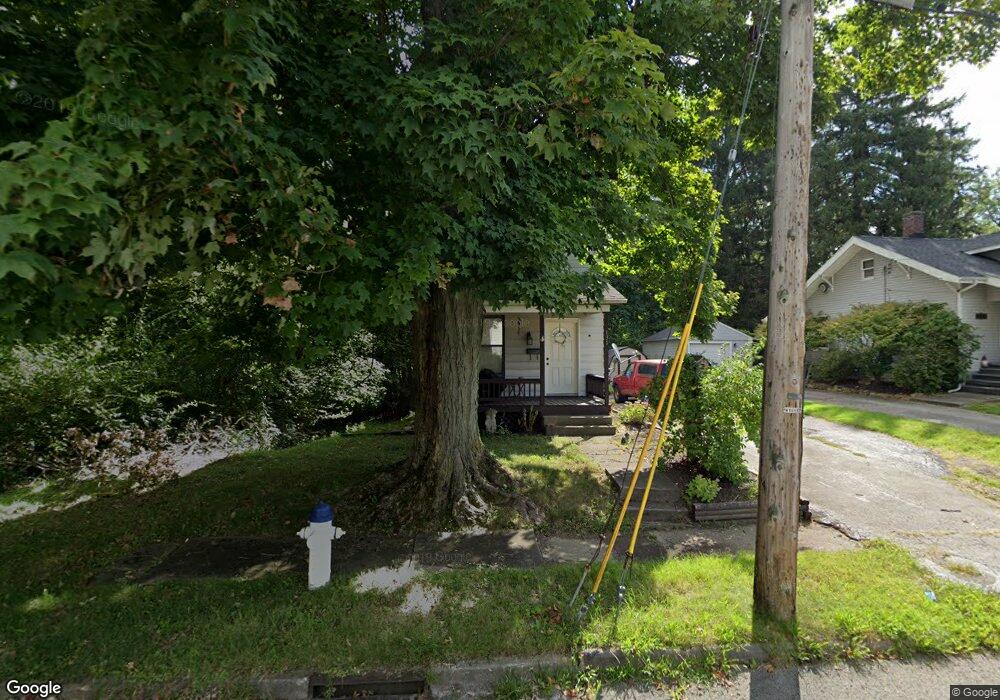
131 Mackey St Hubbard, OH 44425
Estimated Value: $86,000 - $116,000
About This Home
This home is located at 131 Mackey St, Hubbard, OH 44425 and is currently estimated at $99,222, approximately $68 per square foot. 131 Mackey St is a home located in Trumbull County with nearby schools including Hubbard Elementary School, Hubbard Middle School, and Hubbard High School.
Ownership History
We collect this data history from publicly available records. To have your information removed, we recommend requesting removal directly through your county’s website.
Purchase Details
Purchase Details
Purchase Details
Home Financials for this Owner
Home Financials are based on the most recent Mortgage that was taken out on this home.Purchase Details
Home Values in the Area
Average Home Value in this Area
Purchase History
We collect this data history from publicly available records. To have your information removed, we recommend requesting removal directly through your county’s website.
| Date | Buyer | Sale Price | Title Company |
|---|---|---|---|
| $19,900 | Attorney | ||
| $30,000 | Attorney | ||
| $47,000 | -- | ||
| -- | -- |
Mortgage History
We collect this data history from publicly available records. To have your information removed, we recommend requesting removal directly through your county’s website.
| Date | Status | Borrower | Loan Amount |
|---|---|---|---|
| Previous Owner | $46,625 |
Tax History
We collect this data history from publicly available records. To have your information removed, we recommend requesting removal directly through your county’s website.
| Year | Tax Paid | Tax Assessment Tax Assessment Total Assessment is a certain percentage of the fair market value that is determined by local assessors to be the total taxable value of land and additions on the property. | Land | Improvement |
|---|---|---|---|---|
| 2025 | $173 | $3,400 | $3,400 | $0 |
| 2024 | $173 | $8,270 | $4,240 | $4,030 |
| 2023 | $414 | $20,380 | $4,240 | $16,140 |
| 2022 | $788 | $14,360 | $3,820 | $10,540 |
| 2021 | $792 | $14,360 | $3,820 | $10,540 |
| 2020 | $796 | $14,360 | $3,820 | $10,540 |
| 2019 | $759 | $13,130 | $3,820 | $9,310 |
| 2018 | $757 | $13,130 | $3,820 | $9,310 |
| 2017 | $755 | $13,130 | $3,820 | $9,310 |
| 2016 | $660 | $12,190 | $3,820 | $8,370 |
| 2015 | $663 | $12,190 | $3,820 | $8,370 |
| 2014 | $648 | $12,190 | $3,820 | $8,370 |
| 2013 | $647 | $12,190 | $3,820 | $8,370 |
Map
- 0 N Main Unit 5204798
- 211 Ashwood Landing
- 0 Jackson St
- 135 Clingan St
- 203 Hager St
- 323 W Liberty St
- 57 Belle Vista Ave
- 160 Hager St
- 506 Moore St
- 805 Johnny K Blvd
- 210 5th Ave
- 344 Myron St Unit 23
- 784 Elmwood Dr
- 1029 N Main St
- 485 Grandview Ave
- 466 Wendemere Dr
- 911 Dogwood Dr SE
- 663 Meadowland Dr
- 1171 Doris Dr
- 211 Parish Ave
Ask me questions while you tour the home.