
Seller's Agent in 2024
Josh M. Underwood
HomeSmart
(480) 390-7660
2 in this area
66 Total Sales
Estimated Value: $426,332 - $444,000
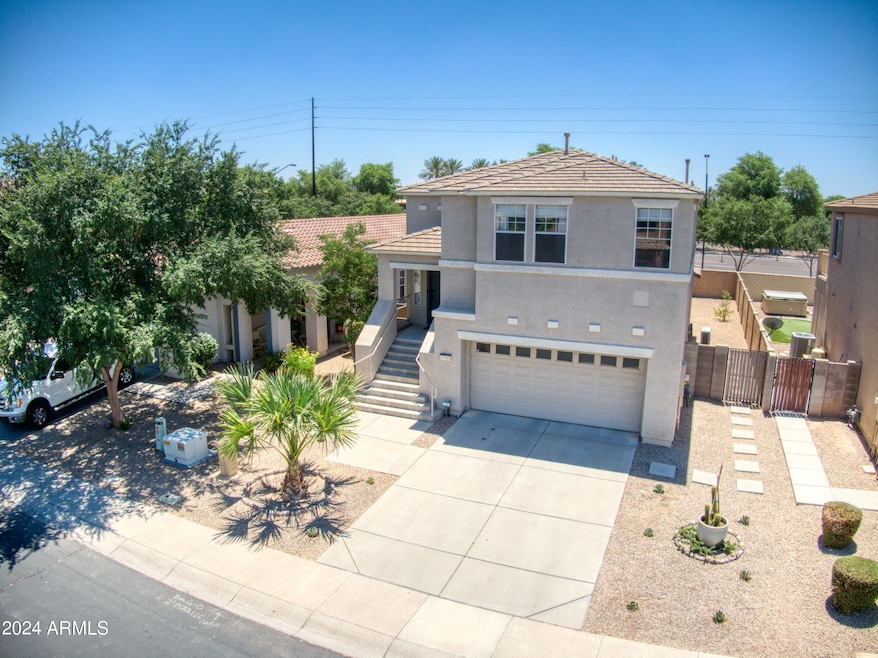
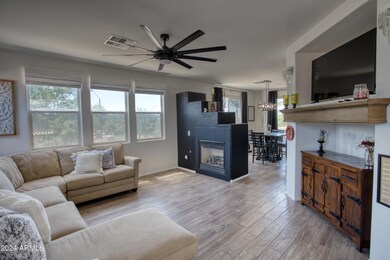
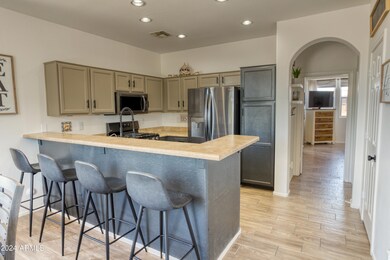
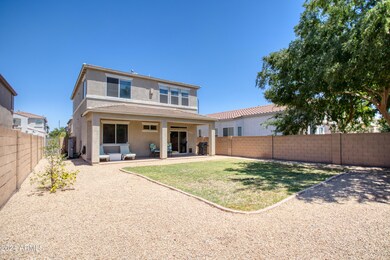
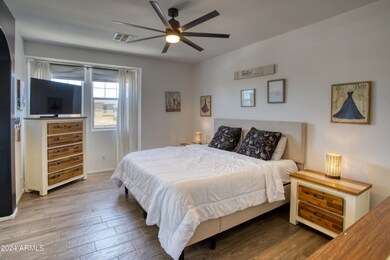
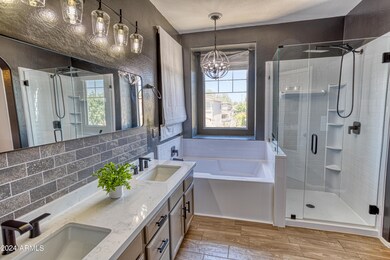
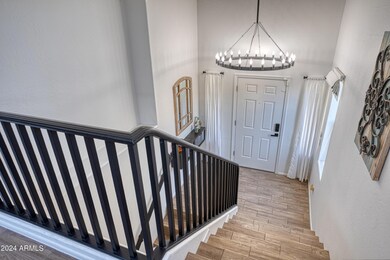
If your priority is location, this is the one! Located in the Spectrum at Val Vista subdivision, it's within walking distance to San Tan Village & all of the best dining & shopping Gilbert has to offer. The home has been beautifully updated with tile floors & has a great 2 bedroom/2.5-bathroom layout with two separate living spaces. One downstairs living space with a large bedroom & bathroom. The 2nd floor features an additional living room space, gas fireplace, & dining area off the kitchen to entertain guests. The larger owner's suite tops off the 2nd floor with an amazing bathroom remodel. The perfect low-maintenance home with all of the bells & whistles!
Last Agent to Sell the Property
HomeSmart License #SA553917000 Listed on: 06/20/2024
We collect this data history from publicly available records. To have your information removed, we recommend requesting removal directly through your county’s website.
We collect this data history from publicly available records. To have your information removed, we recommend requesting removal directly through your county’s website.
| Date | Buyer | Sale Price | Title Company |
|---|---|---|---|
| $450,000 | Empire Title Agency | ||
| $498,500 | Stewart Title & Trust Of Phoen | ||
| $465,000 | New Title Company Name | ||
| $198,000 | Security Title Agency Inc | ||
| $149,900 | Stewart Title & Trust Of Pho | ||
| -- | Lsi Title Company | ||
| $145,000 | None Available | ||
| -- | None Available | ||
| -- | Lawyers Title Insurance Corp | ||
| -- | Lawyers Title Insurance Corp | ||
| -- | None Available | ||
| -- | Chicago Title Insurance Co | ||
| -- | Chicago Title Insurance Co | ||
| $259,561 | Chicago Title Insurance Co |
We collect this data history from publicly available records. To have your information removed, we recommend requesting removal directly through your county’s website.
| Date | Status | Borrower | Loan Amount |
|---|---|---|---|
| Open | $441,849 | ||
| Previous Owner | $473,575 | ||
| Previous Owner | $418,500 | ||
| Previous Owner | $158,400 | ||
| Previous Owner | $148,000 | ||
| Previous Owner | $147,184 | ||
| Previous Owner | $58,162 | ||
| Previous Owner | $224,000 | ||
| Previous Owner | $56,568 | ||
| Previous Owner | $207,648 | ||
| Previous Owner | $207,648 | ||
| Previous Owner | $207,648 |
We collect this data history from publicly available records. To have your information removed, we recommend requesting removal directly through your county’s website.
| Date | Event | Price | List to Sale | Price per Sq Ft | Prior Sale |
|---|---|---|---|---|---|
| 11/18/2024 11/18/24 | Sold | $450,000 | +0.2% | $279 / Sq Ft | |
| 11/01/2024 11/01/24 | Price Changed | $449,000 | -3.4% | $278 / Sq Ft | |
| 09/24/2024 09/24/24 | Price Changed | $465,000 | -2.1% | $288 / Sq Ft | |
| 09/03/2024 09/03/24 | Price Changed | $474,900 | -1.0% | $294 / Sq Ft | |
| 07/09/2024 07/09/24 | Price Changed | $479,900 | -2.0% | $297 / Sq Ft | |
| 06/20/2024 06/20/24 | For Sale | $489,900 | -1.7% | $303 / Sq Ft | |
| 10/09/2023 10/09/23 | Sold | $498,500 | 0.0% | $309 / Sq Ft | View Prior Sale |
| 09/06/2023 09/06/23 | Price Changed | $498,500 | -3.2% | $309 / Sq Ft | |
| 08/18/2023 08/18/23 | Price Changed | $515,000 | -1.9% | $319 / Sq Ft | |
| 07/14/2023 07/14/23 | For Sale | $525,000 | +12.9% | $325 / Sq Ft | |
| 06/01/2022 06/01/22 | Sold | $465,000 | -2.1% | $288 / Sq Ft | View Prior Sale |
| 05/16/2022 05/16/22 | Pending | -- | -- | -- | |
| 05/13/2022 05/13/22 | For Sale | $475,000 | 0.0% | $294 / Sq Ft | |
| 05/09/2022 05/09/22 | Pending | -- | -- | -- | |
| 04/20/2022 04/20/22 | For Sale | $475,000 | +139.9% | $294 / Sq Ft | |
| 07/02/2015 07/02/15 | Sold | $198,000 | -3.4% | $123 / Sq Ft | View Prior Sale |
| 05/29/2015 05/29/15 | For Sale | $205,000 | -- | $127 / Sq Ft |
We collect this data history from publicly available records. To have your information removed, we recommend requesting removal directly through your county’s website.
| Year | Tax Paid | Tax Assessment Tax Assessment Total Assessment is a certain percentage of the fair market value that is determined by local assessors to be the total taxable value of land and additions on the property. | Land | Improvement |
|---|---|---|---|---|
| 2025 | $1,366 | $18,193 | ||
| 2024 | $1,354 | $17,327 | ||
| 2023 | $1,354 | $31,030 | $6,200 | $24,830 |
| 2022 | $1,314 | $23,450 | $4,690 | $18,760 |
| 2021 | $1,633 | $22,410 | $4,480 | $17,930 |
| 2020 | $1,608 | $19,910 | $3,980 | $15,930 |
| 2019 | $1,252 | $18,430 | $3,680 | $14,750 |
| 2018 | $1,213 | $17,350 | $3,470 | $13,880 |
| 2017 | $1,171 | $16,670 | $3,330 | $13,340 |
| 2016 | $1,201 | $16,310 | $3,260 | $13,050 |
| 2015 | $1,102 | $15,580 | $3,110 | $12,470 |
Seller's Agent in 2024
Josh M. Underwood
HomeSmart
(480) 390-7660
2 in this area
66 Total Sales
Buyer's Agent in 2024
Joanne Hardy
Close Pros Real Estate and Management
(602) 380-8857
1 in this area
35 Total Sales
Buyer's Agent in 2023
Danielle Aufmann
My Home Group Real Estate
(480) 226-5188
1 in this area
6 Total Sales
D
Buyer's Agent in 2023
Danielle Faulkner
HomeSmart
K
Seller's Agent in 2022
Kristi Hinkle
OfferPad Brokerage, LLC
Buyer's Agent in 2022
Brad Turk
eXp Realty
(602) 369-0007
1 in this area
38 Total Sales
Source: Arizona Regional Multiple Listing Service (ARMLS)
MLS Number: 6721565
APN: 304-46-128
Disclaimer: Certain information contained herein is derived from information provided by parties other than Homes.com. All information provided is deemed reliable, but is not guaranteed to be accurate and should be independently verified.
![]() All information should be verified by the recipient and none is guaranteed as accurate by ARMLS
All information should be verified by the recipient and none is guaranteed as accurate by ARMLS
Listing Information presented by local MLS brokerage: Ten-X, local REALTOR®- Arlene Richardson - (888)-952-6393
Ask me questions while you tour the home.