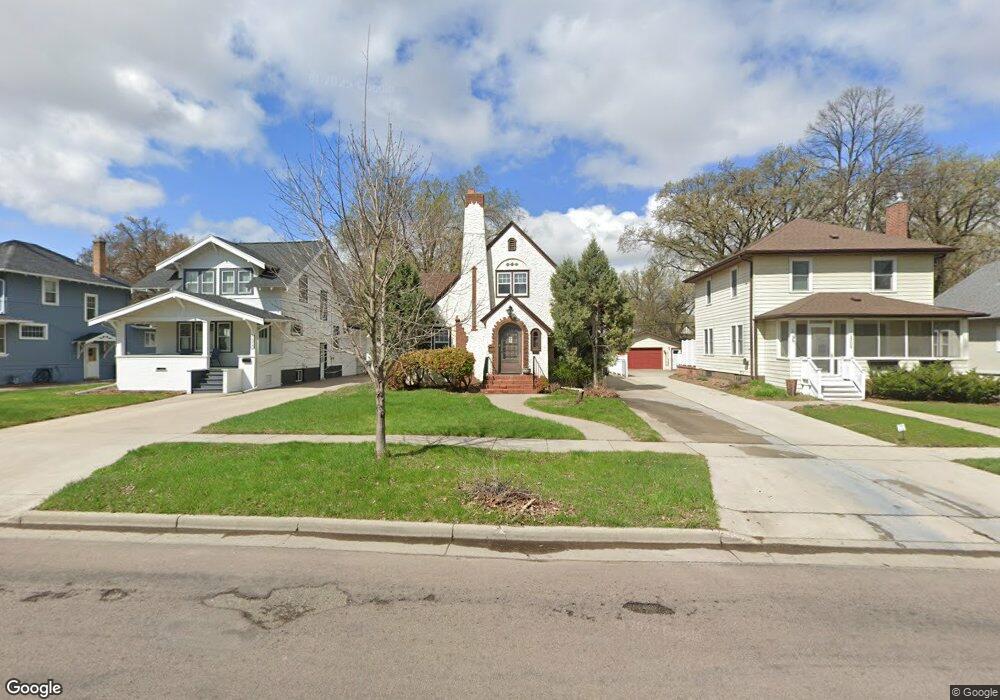
1315 8th St S Fargo, ND 58103
Clara Barton NeighborhoodEstimated Value: $355,000 - $438,000
4
Beds
3
Baths
2,031
Sq Ft
$196/Sq Ft
Est. Value
About This Home
This home is located at 1315 8th St S, Fargo, ND 58103 and is currently estimated at $398,047, approximately $195 per square foot. 1315 8th St S is a home located in Cass County with nearby schools including Clara Barton Elementary School, Carl Ben Eielson Middle School, and South High School.
Ownership History
Date
Name
Owned For
Owner Type
Purchase Details
Closed on
Nov 16, 2018
Sold by
Boyer Leonard O
Bought by
Enockson Ken A and Enockson Michelle I
Current Estimated Value
Purchase Details
Closed on
Nov 25, 2008
Sold by
Mcgrath Wayne G and Bergloff Paula J
Bought by
Wiley Catherine A
Home Financials for this Owner
Home Financials are based on the most recent Mortgage that was taken out on this home.
Original Mortgage
$136,192
Interest Rate
5.5%
Mortgage Type
FHA
Purchase Details
Closed on
Jul 18, 2005
Sold by
Berthold John M and Berthold Kari A
Bought by
Tomanek Charles L and Tomanek Kristen N
Create a Home Valuation Report for This Property
The Home Valuation Report is an in-depth analysis detailing your home's value as well as a comparison with similar homes in the area
Home Values in the Area
Average Home Value in this Area
Purchase History
| Date | Buyer | Sale Price | Title Company |
|---|---|---|---|
| Enockson Ken A | $115,000 | Plains Title Llc | |
| Wiley Catherine A | -- | -- | |
| Tomanek Charles L | -- | -- |
Source: Public Records
Mortgage History
| Date | Status | Borrower | Loan Amount |
|---|---|---|---|
| Previous Owner | Wiley Catherine A | $136,192 |
Source: Public Records
Tax History
| Year | Tax Paid | Tax Assessment Tax Assessment Total Assessment is a certain percentage of the fair market value that is determined by local assessors to be the total taxable value of land and additions on the property. | Land | Improvement |
|---|---|---|---|---|
| 2024 | $6,125 | $194,800 | $39,250 | $155,550 |
| 2023 | $5,419 | $169,400 | $39,250 | $130,150 |
| 2022 | $3,709 | $166,100 | $39,250 | $126,850 |
| 2021 | $3,446 | $158,150 | $34,050 | $124,100 |
| 2020 | $3,053 | $143,750 | $34,050 | $109,700 |
| 2019 | $4,306 | $129,500 | $21,450 | $108,050 |
| 2018 | $4,261 | $129,500 | $21,450 | $108,050 |
| 2017 | $2,523 | $125,750 | $21,450 | $104,300 |
| 2016 | $3,775 | $122,100 | $21,450 | $100,650 |
| 2015 | $3,769 | $114,250 | $13,250 | $101,000 |
| 2014 | $2,285 | $103,850 | $13,250 | $90,600 |
| 2013 | $3,718 | $103,850 | $13,250 | $90,600 |
Source: Public Records
Map
Nearby Homes
- 1311 5th St S
- 1348 6th St S
- 1020 6th St S
- 1502 8th St S
- 904 10th St S
- 432 14th Ave S
- 817 9th St S
- 1534 10th St S
- 812 10th St S Unit B9
- 804 10th St S Unit A4
- 1550 8th St S
- 1364 12th Ave S
- 326 10th Ave S Unit 2
- 1330 14th St S
- 451 16th Ave S
- 1329 14th St S
- 1011 14th St S
- 605 7th St S Unit 2
- 1410 14 1 2 St S
- 1416 14 1 2 St S
Your Personal Tour Guide
Ask me questions while you tour the home.