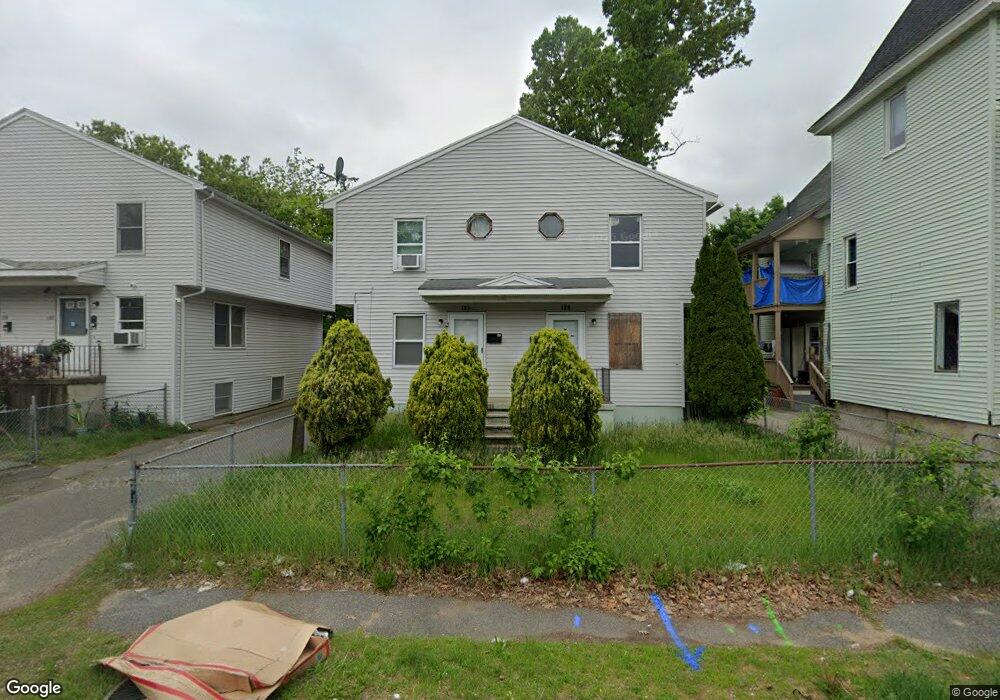
132 Cedar St Unit 134 Springfield, MA 01105
Maple-High Six Corners NeighborhoodEstimated Value: $272,000 - $315,000
6
Beds
2
Baths
1,920
Sq Ft
$148/Sq Ft
Est. Value
About This Home
This home is located at 132 Cedar St Unit 134, Springfield, MA 01105 and is currently estimated at $283,595, approximately $147 per square foot. 132 Cedar St Unit 134 is a home located in Hampden County with nearby schools including Milton Bradley School, M Marcus Kiley Middle, and High School Of Commerce.
Ownership History
Date
Name
Owned For
Owner Type
Purchase Details
Closed on
May 14, 2004
Sold by
Northeast Nt and Bennett Duane C
Bought by
Desouza Sallus
Current Estimated Value
Home Financials for this Owner
Home Financials are based on the most recent Mortgage that was taken out on this home.
Original Mortgage
$115,650
Outstanding Balance
$54,109
Interest Rate
5.47%
Mortgage Type
Purchase Money Mortgage
Estimated Equity
$229,486
Purchase Details
Closed on
Dec 30, 1992
Sold by
R & S Dev Corp
Bought by
New Bk Of Ne
Create a Home Valuation Report for This Property
The Home Valuation Report is an in-depth analysis detailing your home's value as well as a comparison with similar homes in the area
Home Values in the Area
Average Home Value in this Area
Purchase History
We collect this data history from publicly available records. To have your information removed, we recommend requesting removal directly through your county’s website.
| Date | Buyer | Sale Price | Title Company |
|---|---|---|---|
| Desouza Sallus | $128,500 | -- | |
| New Bk Of Ne | $72,200 | -- |
Source: Public Records
Mortgage History
We collect this data history from publicly available records. To have your information removed, we recommend requesting removal directly through your county’s website.
| Date | Status | Borrower | Loan Amount |
|---|---|---|---|
| Open | Desouza Sallus | $115,650 | |
| Previous Owner | New Bk Of Ne | $637,500 |
Source: Public Records
Tax History
| Year | Tax Paid | Tax Assessment Tax Assessment Total Assessment is a certain percentage of the fair market value that is determined by local assessors to be the total taxable value of land and additions on the property. | Land | Improvement |
|---|---|---|---|---|
| 2025 | $3,672 | $234,200 | $25,100 | $209,100 |
| 2024 | $3,096 | $192,800 | $23,500 | $169,300 |
| 2023 | $3,746 | $219,700 | $22,300 | $197,400 |
| 2022 | $3,749 | $199,200 | $20,300 | $178,900 |
| 2021 | $3,561 | $188,400 | $18,500 | $169,900 |
| 2020 | $2,855 | $146,200 | $18,500 | $127,700 |
| 2019 | $2,222 | $112,900 | $18,500 | $94,400 |
| 2018 | $2,434 | $117,400 | $18,500 | $98,900 |
| 2017 | $2,434 | $123,800 | $14,800 | $109,000 |
| 2016 | $2,245 | $114,200 | $14,800 | $99,400 |
| 2015 | $2,179 | $110,800 | $14,800 | $96,000 |
Source: Public Records
Map
Nearby Homes
- 148-150 Cedar St
- 48 Madison Ave
- 229 Central St
- 88 Tyler St
- 101 Mulberry St Unit G3
- 101 Mulberry St Unit 314
- 20 Crosby St
- 536-538 Union St
- 540-542 Union St
- WS Maple St
- SS Maple St
- 54 Ridgewood Place
- 270 Maple St
- 120 Central St
- 199 Eastern Ave
- 435 State St
- 658 Union St
- 0 Allen St (Ss)
- 27 Chester St
- 36-38 Chapel St
Your Personal Tour Guide
Ask me questions while you tour the home.