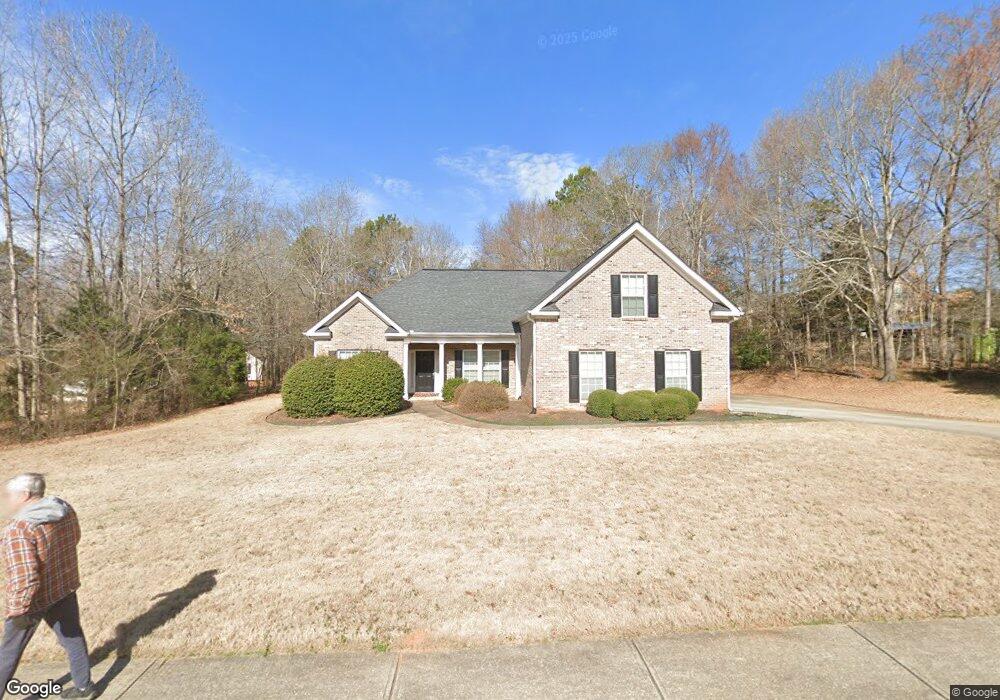
132 Flagstone Ave Jefferson, GA 30549
Estimated Value: $324,000 - $342,000
3
Beds
2
Baths
2,048
Sq Ft
$164/Sq Ft
Est. Value
About This Home
This home is located at 132 Flagstone Ave, Jefferson, GA 30549 and is currently estimated at $335,934, approximately $164 per square foot. 132 Flagstone Ave is a home located in Jackson County with nearby schools including South Jackson Elementary School, East Jackson Middle School, and East Jackson Comprehensive High School.
Ownership History
Date
Name
Owned For
Owner Type
Purchase Details
Closed on
Mar 24, 2017
Sold by
Howell Julie Alayne
Bought by
Coates Christina L and Coates Laurence J
Current Estimated Value
Home Financials for this Owner
Home Financials are based on the most recent Mortgage that was taken out on this home.
Original Mortgage
$176,739
Outstanding Balance
$147,186
Interest Rate
4.75%
Mortgage Type
FHA
Estimated Equity
$188,748
Purchase Details
Closed on
Dec 30, 2005
Sold by
Chesser/ Kennedy Builders
Bought by
Johnson Julie Alayne
Home Financials for this Owner
Home Financials are based on the most recent Mortgage that was taken out on this home.
Original Mortgage
$133,500
Interest Rate
6.18%
Mortgage Type
New Conventional
Purchase Details
Closed on
Aug 13, 2004
Sold by
Walthoo Developement Llc
Bought by
Chesser/ Kennedy Builders
Create a Home Valuation Report for This Property
The Home Valuation Report is an in-depth analysis detailing your home's value as well as a comparison with similar homes in the area
Home Values in the Area
Average Home Value in this Area
Purchase History
| Date | Buyer | Sale Price | Title Company |
|---|---|---|---|
| Coates Christina L | $180,000 | -- | |
| Johnson Julie Alayne | $166,900 | -- | |
| Chesser/ Kennedy Builders | -- | -- |
Source: Public Records
Mortgage History
| Date | Status | Borrower | Loan Amount |
|---|---|---|---|
| Open | Coates Christina L | $176,739 | |
| Previous Owner | Johnson Julie Alayne | $133,500 | |
| Previous Owner | Johnson Julie Alayne | $10,000 |
Source: Public Records
Tax History
| Year | Tax Paid | Tax Assessment Tax Assessment Total Assessment is a certain percentage of the fair market value that is determined by local assessors to be the total taxable value of land and additions on the property. | Land | Improvement |
|---|---|---|---|---|
| 2025 | $2,792 | $107,200 | $12,880 | $94,320 |
| 2024 | $2,792 | $107,200 | $12,880 | $94,320 |
| 2023 | $2,782 | $97,120 | $12,880 | $84,240 |
| 2022 | $2,331 | $81,160 | $12,880 | $68,280 |
| 2021 | $2,347 | $81,160 | $12,880 | $68,280 |
| 2020 | $2,190 | $69,120 | $12,880 | $56,240 |
| 2019 | $2,223 | $69,120 | $12,880 | $56,240 |
| 2018 | $2,164 | $66,360 | $12,880 | $53,480 |
| 2017 | $2,007 | $62,848 | $12,880 | $49,968 |
| 2016 | $2,018 | $62,848 | $12,880 | $49,968 |
| 2015 | $1,865 | $57,968 | $8,000 | $49,968 |
| 2014 | $1,849 | $57,068 | $8,000 | $49,068 |
| 2013 | -- | $56,577 | $8,000 | $48,577 |
Source: Public Records
Map
Nearby Homes
- 41 Lavender Rd
- 90 Birch Ct
- 225 Tyler Way
- 101 Birch Ct
- 144 Briar Rose Blvd
- 123 Briar Rose Blvd
- 4 W Farm Rd
- 139 Anglin Rd
- 2200 Lebanon Church Lot 3 Rd
- 2200 BLOCK Lebanon Church Rd Unit LOT 3
- 2200 BLOCK Lebanon Church Rd Unit LOT 11
- 2200 Lebanon Church Rd
- 347 Clarksboro Dr
- 6392 Athens Hwy
- 356 Clarksboro Dr
- 168 Clarksboro Dr
- 145 Rock Forge Ct
- 91 Marauder Way
- 0 Harrison Johnson Way Unit 10529233
- 7790 Jefferson Rd
- 156 Flagstone Ave
- 31 Redstone Rd Unit 58B
- 127 Flagstone Ave
- 127 Flagstone Ave Unit 1
- 145 Flagstone Ave
- 53 Redstone Rd
- 163 Flagstone Ave
- 81 Redstone Rd
- 26 Redstone Rd
- 48 Redstone Rd
- 36 Flintstone Rd
- 161 Flagstone Ave
- 70 Redstone Rd
- 103 Redstone Rd
- 62 Flintstone Rd Unit Lot 66
- 62 Flintstone Rd
- 133 Redstone Rd
- 70 Flintstone Rd
- 33 Flagstone Ave
- 49 Flintstone Rd
Your Personal Tour Guide
Ask me questions while you tour the home.