Estimated Value: $211,844 - $260,000
3
Beds
2
Baths
1,008
Sq Ft
$237/Sq Ft
Est. Value
About This Home
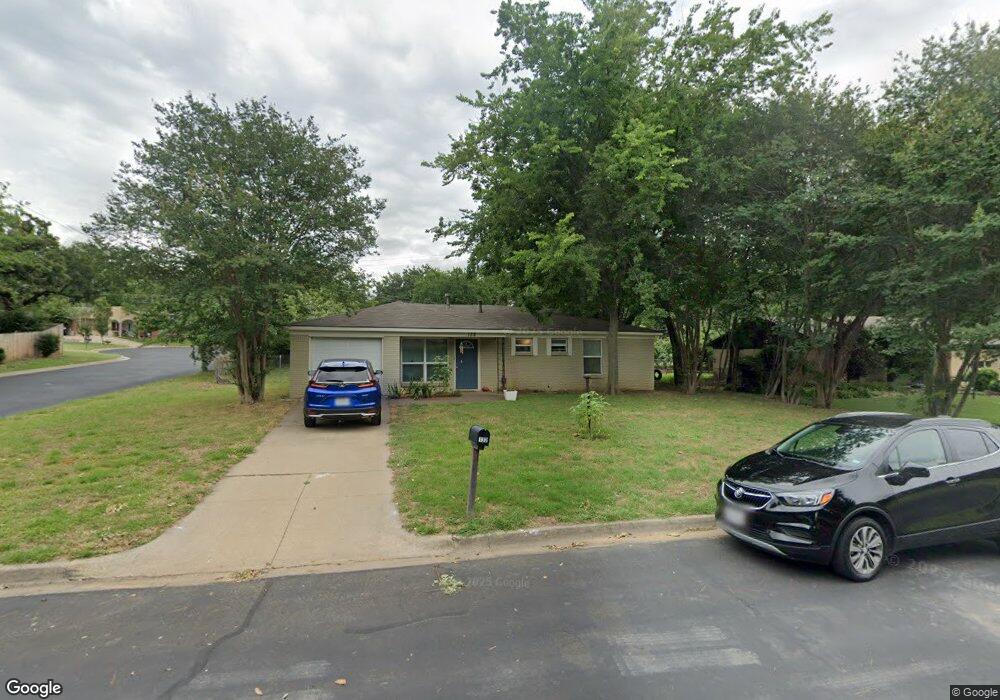
This home is located at 132 Myrtle Ct, Hurst, TX 76053 and is currently estimated at $238,961, approximately $237 per square foot. 132 Myrtle Ct is a home located in Tarrant County with nearby schools including West Hurst Elementary School, Hurst J High School, and L.D. Bell High School.
Ownership History
Date
Name
Owned For
Owner Type
Purchase Details
Closed on
Aug 16, 2013
Sold by
1St Choice House Buyers Inc
Bought by
Blooming Tree Investments Llc
Current Estimated Value
Purchase Details
Closed on
Apr 5, 2013
Sold by
Blanco Eric Martin
Bought by
1St Choice House Buyers Inc
Purchase Details
Closed on
Aug 8, 2008
Sold by
Blanco Jeffrey Marc and Blanco Michael Gregory
Bought by
Blanco Eric Martin
Purchase Details
Closed on
Mar 21, 2006
Sold by
Blanco Jeff
Bought by
Blanco Eric
Create a Home Valuation Report for This Property
The Home Valuation Report is an in-depth analysis detailing your home's value as well as a comparison with similar homes in the area
Home Values in the Area
Average Home Value in this Area
Purchase History
We collect this data history from publicly available records. To have your information removed, we recommend requesting removal directly through your county’s website.
| Date | Buyer | Sale Price | Title Company |
|---|---|---|---|
| Blooming Tree Investments Llc | -- | None Available | |
| 1St Choice House Buyers Inc | -- | None Available | |
| Blanco Eric Martin | -- | None Available | |
| Blanco Eric | -- | None Available |
Source: Public Records
Tax History
| Year | Tax Paid | Tax Assessment Tax Assessment Total Assessment is a certain percentage of the fair market value that is determined by local assessors to be the total taxable value of land and additions on the property. | Land | Improvement |
|---|---|---|---|---|
| 2025 | $3,738 | $182,000 | $42,500 | $139,500 |
| 2024 | $3,738 | $202,661 | $42,500 | $160,161 |
| 2023 | $3,738 | $186,589 | $29,750 | $156,839 |
| 2022 | $3,713 | $161,276 | $29,750 | $131,526 |
| 2021 | $3,501 | $145,163 | $29,750 | $115,413 |
| 2020 | $3,052 | $126,867 | $29,750 | $97,117 |
| 2019 | $3,105 | $126,867 | $29,750 | $97,117 |
| 2018 | $2,964 | $121,091 | $16,150 | $104,941 |
| 2017 | $2,572 | $101,632 | $16,150 | $85,482 |
| 2016 | $2,631 | $103,971 | $16,150 | $87,821 |
| 2015 | $1,337 | $51,000 | $11,475 | $39,525 |
| 2014 | $1,337 | $66,500 | $11,475 | $55,025 |
Source: Public Records
Map
Nearby Homes
- 421 Crosstimber Dr
- 617 Woodside Dr
- 416 Simmons Dr
- 628 W Redbud Dr
- 721 Briarwood Ln
- 800 Treadwell Ct Unit 800B
- 552 Souder Dr
- 260 Corinna Ct
- 709 Hurstview Dr
- 412 Fleming Dr
- 758 Briarwood Ln
- 9221 Shoveler Trail
- 629 Harrison Ln
- 652 Oak Dr
- 736 Oak Dr
- 9300 Wood Duck Dr
- 2988 Thames Trail
- 3216 Fountain Pkwy
- 2956 Timber Creek Trail
- 745 W Cedar St
Your Personal Tour Guide
Ask me questions while you tour the home.