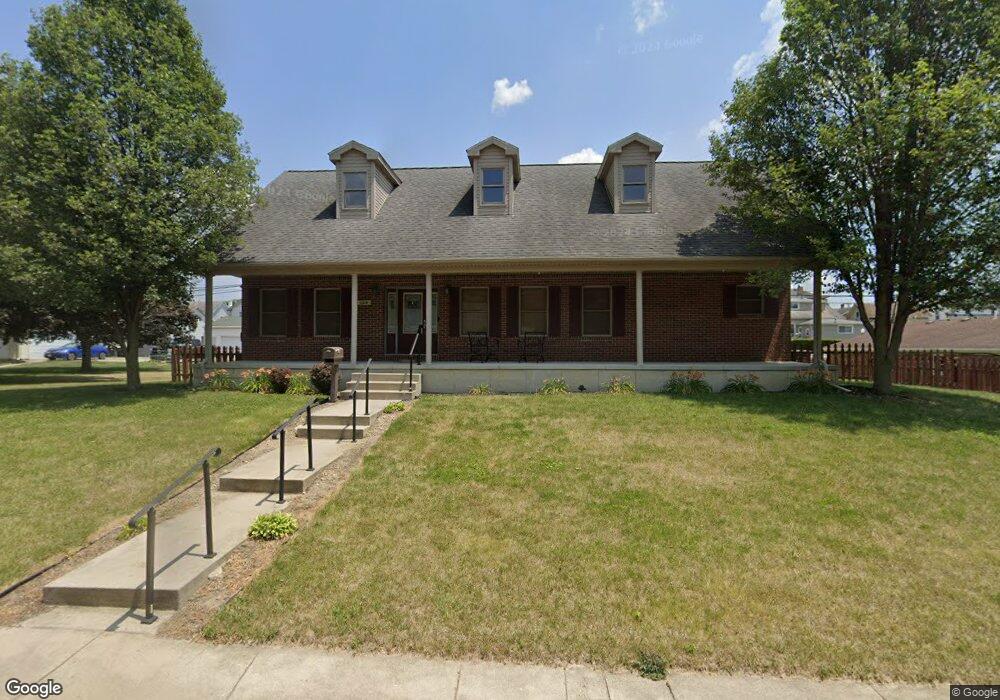
132 S Main St Covington, OH 45318
Estimated Value: $247,000 - $295,949
3
Beds
2
Baths
2,240
Sq Ft
$120/Sq Ft
Est. Value
About This Home
This home is located at 132 S Main St, Covington, OH 45318 and is currently estimated at $269,237, approximately $120 per square foot. 132 S Main St is a home located in Miami County with nearby schools including Covington Elementary/Junior High School, Covington Junior High School, and Covington High School.
Ownership History
Date
Name
Owned For
Owner Type
Purchase Details
Closed on
Jul 21, 2008
Sold by
Furrow Jon E
Bought by
Hedges Michael R and Hedges Heidi B
Current Estimated Value
Purchase Details
Closed on
Jan 8, 2008
Sold by
Stevenson Robert Neil
Bought by
Furrow Jon E
Purchase Details
Closed on
Nov 5, 2003
Sold by
Stevenson Robert Neil and Stevenson Robert N
Bought by
Stevenson Robert Neil
Purchase Details
Closed on
Dec 1, 1979
Bought by
Stevenson Robert N
Create a Home Valuation Report for This Property
The Home Valuation Report is an in-depth analysis detailing your home's value as well as a comparison with similar homes in the area
Home Values in the Area
Average Home Value in this Area
Purchase History
We collect this data history from publicly available records. To have your information removed, we recommend requesting removal directly through your county’s website.
| Date | Buyer | Sale Price | Title Company |
|---|---|---|---|
| Hedges Michael R | $160,000 | -- | |
| Furrow Jon E | $48,000 | -- | |
| Stevenson Robert Neil | $65,000 | -- | |
| Stevenson Robert N | -- | -- |
Source: Public Records
Mortgage History
We collect this data history from publicly available records. To have your information removed, we recommend requesting removal directly through your county’s website.
| Date | Status | Borrower | Loan Amount |
|---|---|---|---|
| Closed | Stevenson Robert Neil | $0 |
Source: Public Records
Tax History
| Year | Tax Paid | Tax Assessment Tax Assessment Total Assessment is a certain percentage of the fair market value that is determined by local assessors to be the total taxable value of land and additions on the property. | Land | Improvement |
|---|---|---|---|---|
| 2025 | $3,315 | $101,570 | $14,350 | $87,220 |
| 2024 | $3,315 | $83,200 | $15,580 | $67,620 |
| 2023 | $3,116 | $83,200 | $15,580 | $67,620 |
| 2022 | $3,108 | $83,200 | $15,580 | $67,620 |
| 2021 | $2,581 | $63,980 | $11,970 | $52,010 |
| 2020 | $2,586 | $63,980 | $11,970 | $52,010 |
| 2019 | $2,125 | $52,330 | $4,870 | $47,460 |
| 2018 | $1,805 | $44,350 | $3,220 | $41,130 |
| 2017 | $1,837 | $44,350 | $3,220 | $41,130 |
| 2016 | $1,813 | $44,350 | $3,220 | $41,130 |
| 2015 | $1,670 | $42,630 | $3,080 | $39,550 |
| 2014 | $1,670 | $42,630 | $3,080 | $39,550 |
| 2013 | $1,608 | $42,630 | $3,080 | $39,550 |
Source: Public Records
Map
Nearby Homes
Your Personal Tour Guide
Ask me questions while you tour the home.