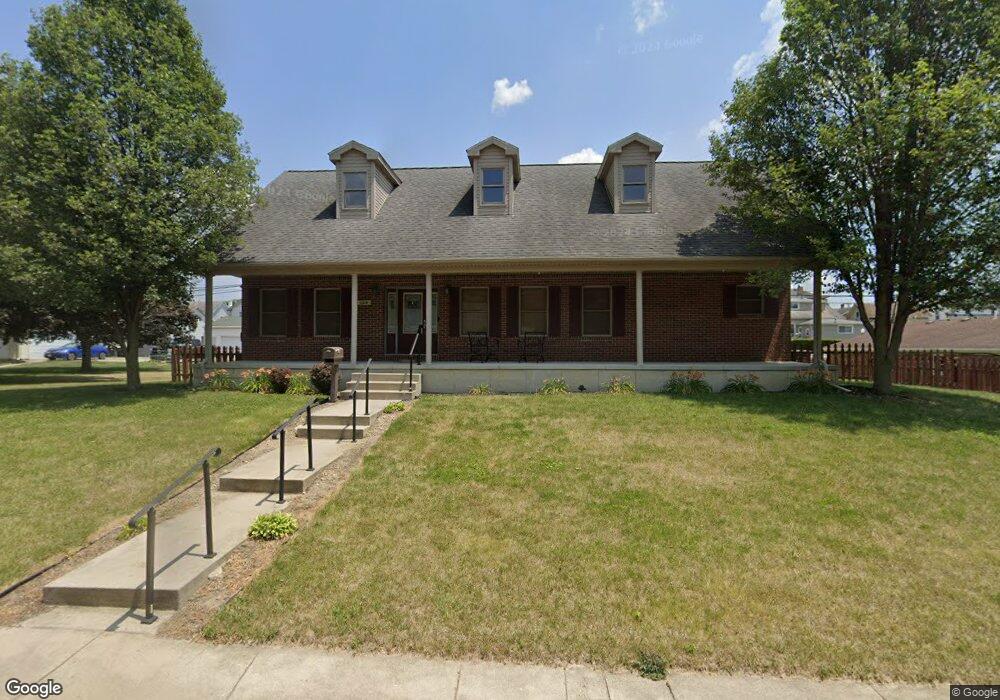
132 S Main St Covington, OH 45318
Estimated Value: $249,000 - $292,255
About This Home
This home is located at 132 S Main St, Covington, OH 45318 and is currently estimated at $274,314, approximately $167 per square foot. 132 S Main St is a home located in Miami County with nearby schools including Covington Elementary/Junior High School, Covington Junior High School, and Covington High School.
Ownership History
We collect this data history from publicly available records. To have your information removed, we recommend requesting removal directly through your county’s website.
Purchase Details
Purchase Details
Purchase Details
Purchase Details
Home Values in the Area
Average Home Value in this Area
Purchase History
We collect this data history from publicly available records. To have your information removed, we recommend requesting removal directly through your county’s website.
| Date | Buyer | Sale Price | Title Company |
|---|---|---|---|
| $160,000 | -- | ||
| $48,000 | -- | ||
| $65,000 | -- | ||
| -- | -- |
Mortgage History
We collect this data history from publicly available records. To have your information removed, we recommend requesting removal directly through your county’s website.
| Date | Status | Borrower | Loan Amount |
|---|---|---|---|
| Closed | $0 |
Tax History
We collect this data history from publicly available records. To have your information removed, we recommend requesting removal directly through your county’s website.
| Year | Tax Paid | Tax Assessment Tax Assessment Total Assessment is a certain percentage of the fair market value that is determined by local assessors to be the total taxable value of land and additions on the property. | Land | Improvement |
|---|---|---|---|---|
| 2025 | $3,315 | $101,570 | $14,350 | $87,220 |
| 2024 | $3,315 | $83,200 | $15,580 | $67,620 |
| 2023 | $3,116 | $83,200 | $15,580 | $67,620 |
| 2022 | $3,108 | $83,200 | $15,580 | $67,620 |
| 2021 | $2,581 | $63,980 | $11,970 | $52,010 |
| 2020 | $2,586 | $63,980 | $11,970 | $52,010 |
| 2019 | $2,125 | $52,330 | $4,870 | $47,460 |
| 2018 | $1,805 | $44,350 | $3,220 | $41,130 |
| 2017 | $1,837 | $44,350 | $3,220 | $41,130 |
| 2016 | $1,813 | $44,350 | $3,220 | $41,130 |
| 2015 | $1,670 | $42,630 | $3,080 | $39,550 |
| 2014 | $1,670 | $42,630 | $3,080 | $39,550 |
| 2013 | $1,608 | $42,630 | $3,080 | $39,550 |
Map
- 7 S Main St
- 224 E Walnut St
- 251 N Ludlow St
- 698 E Broadway St
- 305 Sharon St
- 731 N Pearl St
- 762 N High St
- 7071 W State Route 41
- 8040 N State Route 48
- 00 Sugar Grove-Circle Hill Rd
- 5505 Buckneck Rd
- 7131 N Spiker Rd
- 7855 N Brad Bloomer Rd
- 419 E Main St
- 219 E Church St
- 112 W James St
- 317 S Miami Ave
- 7855 Bradford Bloomer Rd
- 105 N Miami Ave
- 0 Lauver Rd
Ask me questions while you tour the home.