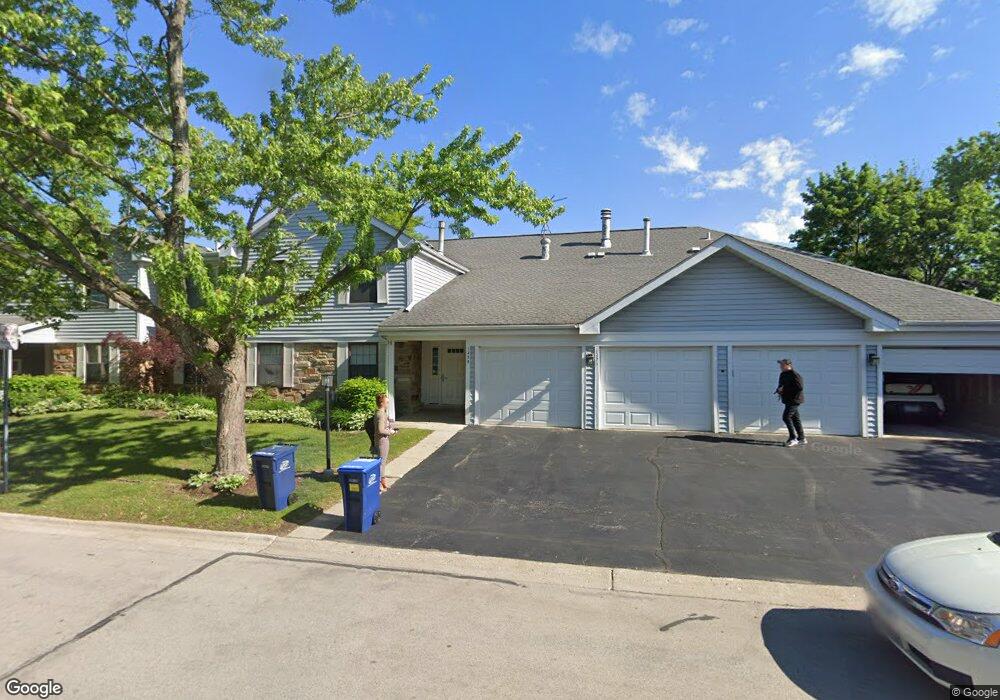
1326 Williamsburg Dr Unit 511 Schaumburg, IL 60193
East Schaumburg NeighborhoodEstimated Value: $251,850 - $274,000
2
Beds
--
Bath
1,500
Sq Ft
$177/Sq Ft
Est. Value
About This Home
This home is located at 1326 Williamsburg Dr Unit 511, Schaumburg, IL 60193 and is currently estimated at $264,963, approximately $176 per square foot. 1326 Williamsburg Dr Unit 511 is a home located in Cook County with nearby schools including Michael Collins Elementary School, Margaret Mead Junior High School, and J B Conant High School.
Ownership History
Date
Name
Owned For
Owner Type
Purchase Details
Closed on
May 1, 2024
Sold by
Wahle George and Wahle Patricia
Bought by
Wahle George
Current Estimated Value
Purchase Details
Closed on
Aug 13, 2018
Sold by
Vigna Lindsay
Bought by
Wahle Patricia and Wahle George
Purchase Details
Closed on
Dec 19, 2016
Sold by
Wells Kristina R
Bought by
Vigna Lindsay
Home Financials for this Owner
Home Financials are based on the most recent Mortgage that was taken out on this home.
Original Mortgage
$138,175
Interest Rate
4.62%
Mortgage Type
New Conventional
Purchase Details
Closed on
Nov 15, 2012
Sold by
Dimaria Julie K
Bought by
Wells Kristina R
Home Financials for this Owner
Home Financials are based on the most recent Mortgage that was taken out on this home.
Original Mortgage
$97,206
Interest Rate
3.25%
Mortgage Type
FHA
Create a Home Valuation Report for This Property
The Home Valuation Report is an in-depth analysis detailing your home's value as well as a comparison with similar homes in the area
Home Values in the Area
Average Home Value in this Area
Purchase History
| Date | Buyer | Sale Price | Title Company |
|---|---|---|---|
| Wahle George | $83,000 | None Listed On Document | |
| Wahle George | $83,000 | None Listed On Document | |
| Wahle Patricia | $165,000 | Chicago Title | |
| Vigna Lindsay | $146,500 | Attorney | |
| Wells Kristina R | $99,000 | None Available |
Source: Public Records
Mortgage History
| Date | Status | Borrower | Loan Amount |
|---|---|---|---|
| Previous Owner | Vigna Lindsay | $138,175 | |
| Previous Owner | Wells Kristina R | $97,206 |
Source: Public Records
Tax History
| Year | Tax Paid | Tax Assessment Tax Assessment Total Assessment is a certain percentage of the fair market value that is determined by local assessors to be the total taxable value of land and additions on the property. | Land | Improvement |
|---|---|---|---|---|
| 2025 | $3,456 | $22,321 | $3,570 | $18,751 |
| 2024 | $3,456 | $15,654 | $3,808 | $11,846 |
| 2023 | $3,323 | $15,654 | $3,808 | $11,846 |
| 2022 | $3,323 | $15,654 | $3,808 | $11,846 |
| 2021 | $2,811 | $12,604 | $4,879 | $7,725 |
| 2020 | $2,830 | $12,604 | $4,879 | $7,725 |
| 2019 | $3,756 | $14,013 | $4,879 | $9,134 |
| 2018 | $1,876 | $9,687 | $4,105 | $5,582 |
| 2017 | $1,864 | $9,687 | $4,105 | $5,582 |
| 2016 | $1,986 | $9,687 | $4,105 | $5,582 |
| 2015 | $1,694 | $8,284 | $3,570 | $4,714 |
| 2014 | $1,691 | $8,284 | $3,570 | $4,714 |
| 2013 | $2,388 | $8,284 | $3,570 | $4,714 |
Source: Public Records
Map
Nearby Homes
- 1325 Williamsburg Dr Unit C1
- 267 Northbury Ct Unit D2
- 310 Oak Meadow Ct Unit D2
- 1497 Whitman Ct
- 52 Brookston Dr Unit D2
- 380 Heather Ct Unit B2
- 1220 Plum Tree Ct Unit D2
- 101 Bar Harbour Rd Unit 2
- 374 Southbury Ct Unit A-1
- 263 Driftwood Ln Unit C1
- 1343 Scarboro Rd Unit 601
- 1355 Beckett Ln
- 1634 Vermont Dr Unit 41
- 236 Saugus Ln
- 170 Inverness Ct Unit 1
- 227 Parktrail Ct Unit 525
- 1532 Petersham Ln
- 135 Corsaire Ln
- 244 Steeplechase Ct
- 1890 Pebble Beach Cir
- 1326 Williamsburg Dr Unit 511
- 1326 Williamsburg Dr Unit 511
- 1326 Williamsburg Dr Unit 511
- 1326 Williamsburg Dr Unit C1
- 1326 Williamsburg Dr Unit D-2
- 1326 Williamsburg Dr Unit D1
- 1324 Williamsburg Dr Unit D2
- 1324 Williamsburg Dr Unit 511
- 1324 Williamsburg Dr Unit 511
- 1324 Williamsburg Dr Unit 511
- 1324 Williamsburg Dr Unit 511
- 1324 Williamsburg Dr Unit B2
- 1324 Williamsburg Dr Unit D1
- 1325 Williamsburg Dr Unit D2
- 1325 Williamsburg Dr Unit 518
- 1325 Williamsburg Dr Unit 518
- 1325 Williamsburg Dr Unit 518
- 1325 Williamsburg Dr Unit 518
- 1325 Williamsburg Dr Unit D1
- 1325 Williamsburg Dr Unit C2
Your Personal Tour Guide
Ask me questions while you tour the home.